


 177 / 231

Brasil
PackTrends
2020
177
sustainability & ethics
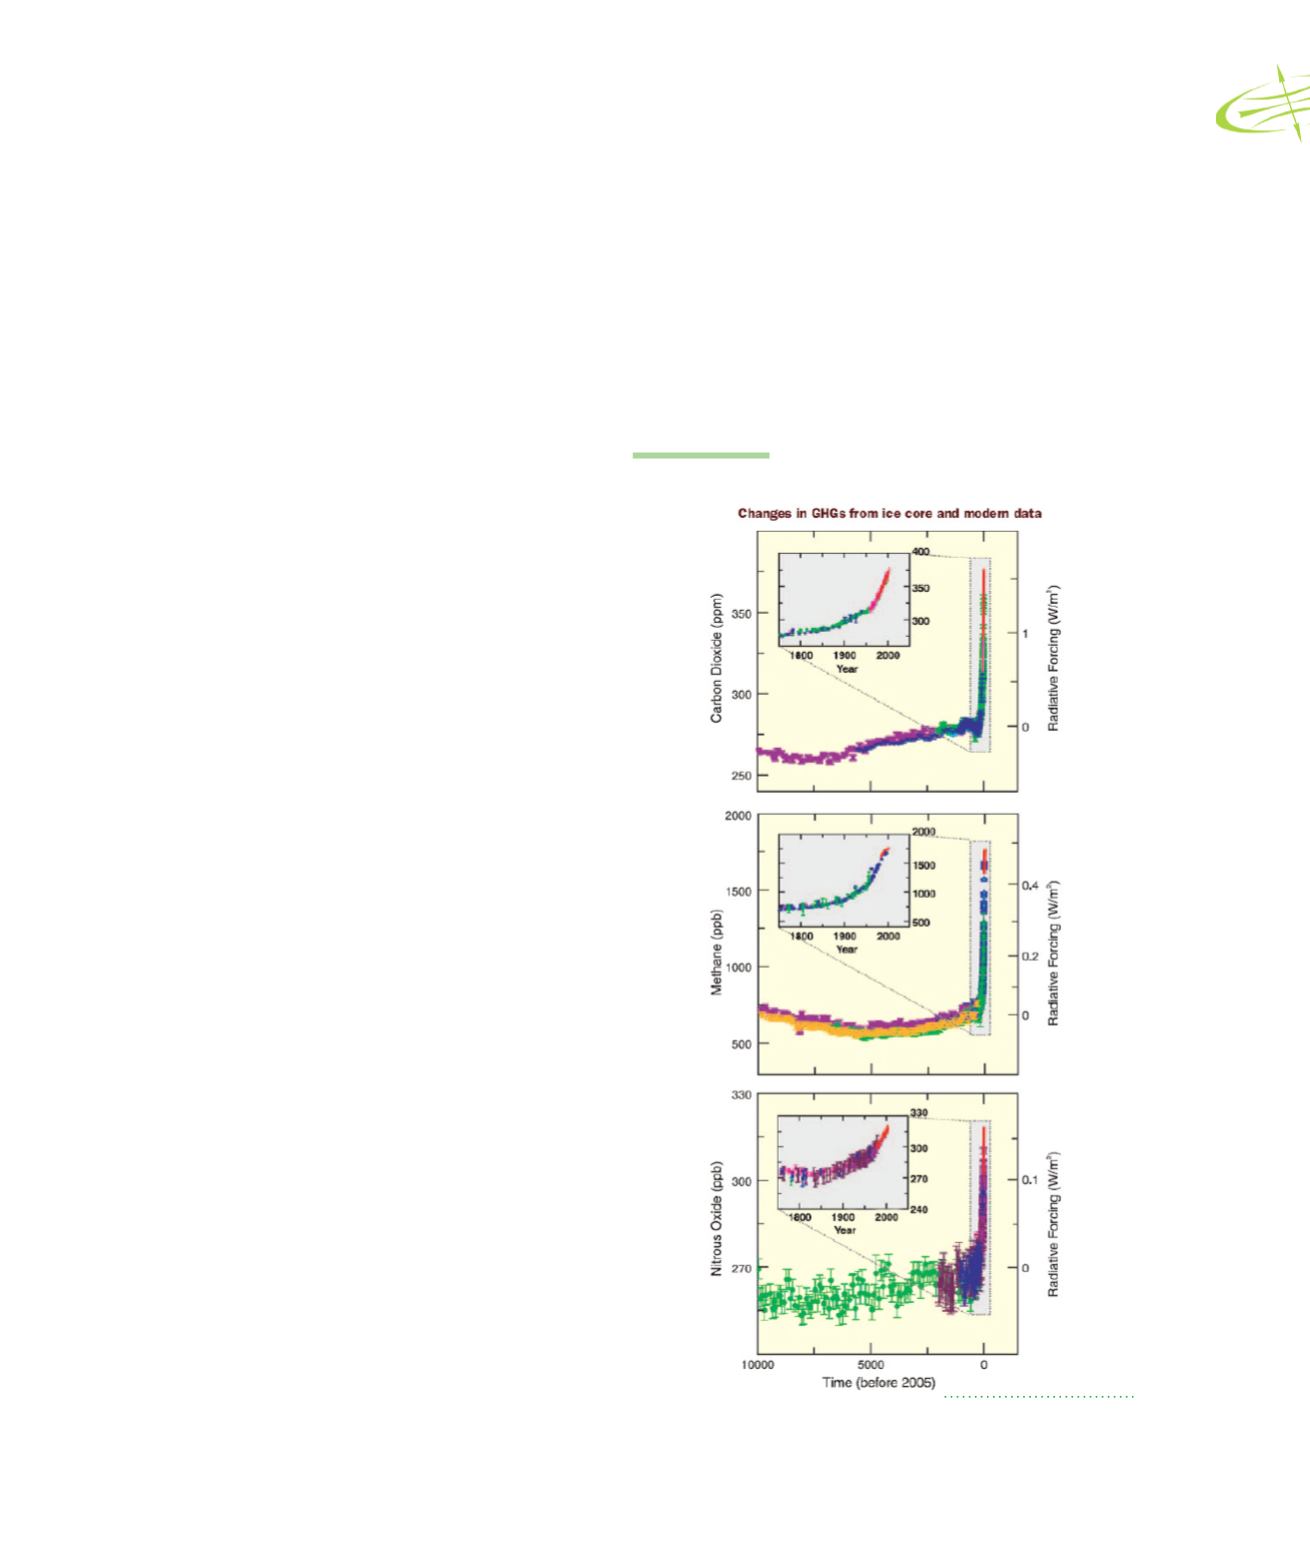
FIGURE 7.2
Atmospheric concentrations
The changes in the atmospheric concentrations
of greenhouse gases and aerosols, land cover and solar
radiation alter the energy balance of the climate system
and are considered drivers of the climate change.
The greenhouse gas change affects the scattering,
absorption and emission of radiation within the
atmosphere and at the Earth’s surface. The resulting
positive or negative changes in energy balance due
to these factors are expressed as “radiative forcing”,
which is used to compare warming or cooling influences
on global climate.
Human activities produce mainly four types
of long-life greenhouse gases: carbon dioxide (CO
2
),
methane (CH
4
), nitrous oxide (N
2
O), and halocarbons
(a group of gases that contain fluorine, chlorine and
bromine). The global atmospheric concentrations of
CO
2
and CH
4
in 2005 exceed by far the natural range
over the previous 650,000 years (FIGURE 7.2).
The increase of the CO
2
concentration is mainly
due to the use of fossil fuels and, at a lower scale, due to
land-use change. It is very likely that the increase of the
CH
4
concentration is predominantly due to agriculture
and fossil fuel use. The increase in N
2
O concentration
is mainly due to agriculture.
The 4
th
IPCC report also concluded that the
observed changes since the second half of the 20
th
century are very likely due to the observed increase of
greenhouse gases by anthropogenic action, as shown in
Figure 7.3. The warming of the atmosphere and oceans
observed on a large scale, together with the loss of
ice mass, support the conclusion that it is extremely
unlikely that the global climate change of the last 50
years can be explained without external forcing and very
likely that it is not due to known natural causes alone.
Climate changes causes
Atmospheric concentrations of CO
2
, CH
4
and
N
2
O over the last 10,000 years (large graphs)
and since 1750 (small graphs). Measurements
have been performed on ice cores (symbols
with different colors for different studies) and
atmospheric samples (red lines). The values
corresponding to radiative forcings are shown on
the right hand axes of the large graphs.
Source: IPCC, 2007