


 176 / 231

Brasil
PackTrends
2020
176
sustainability & ethics
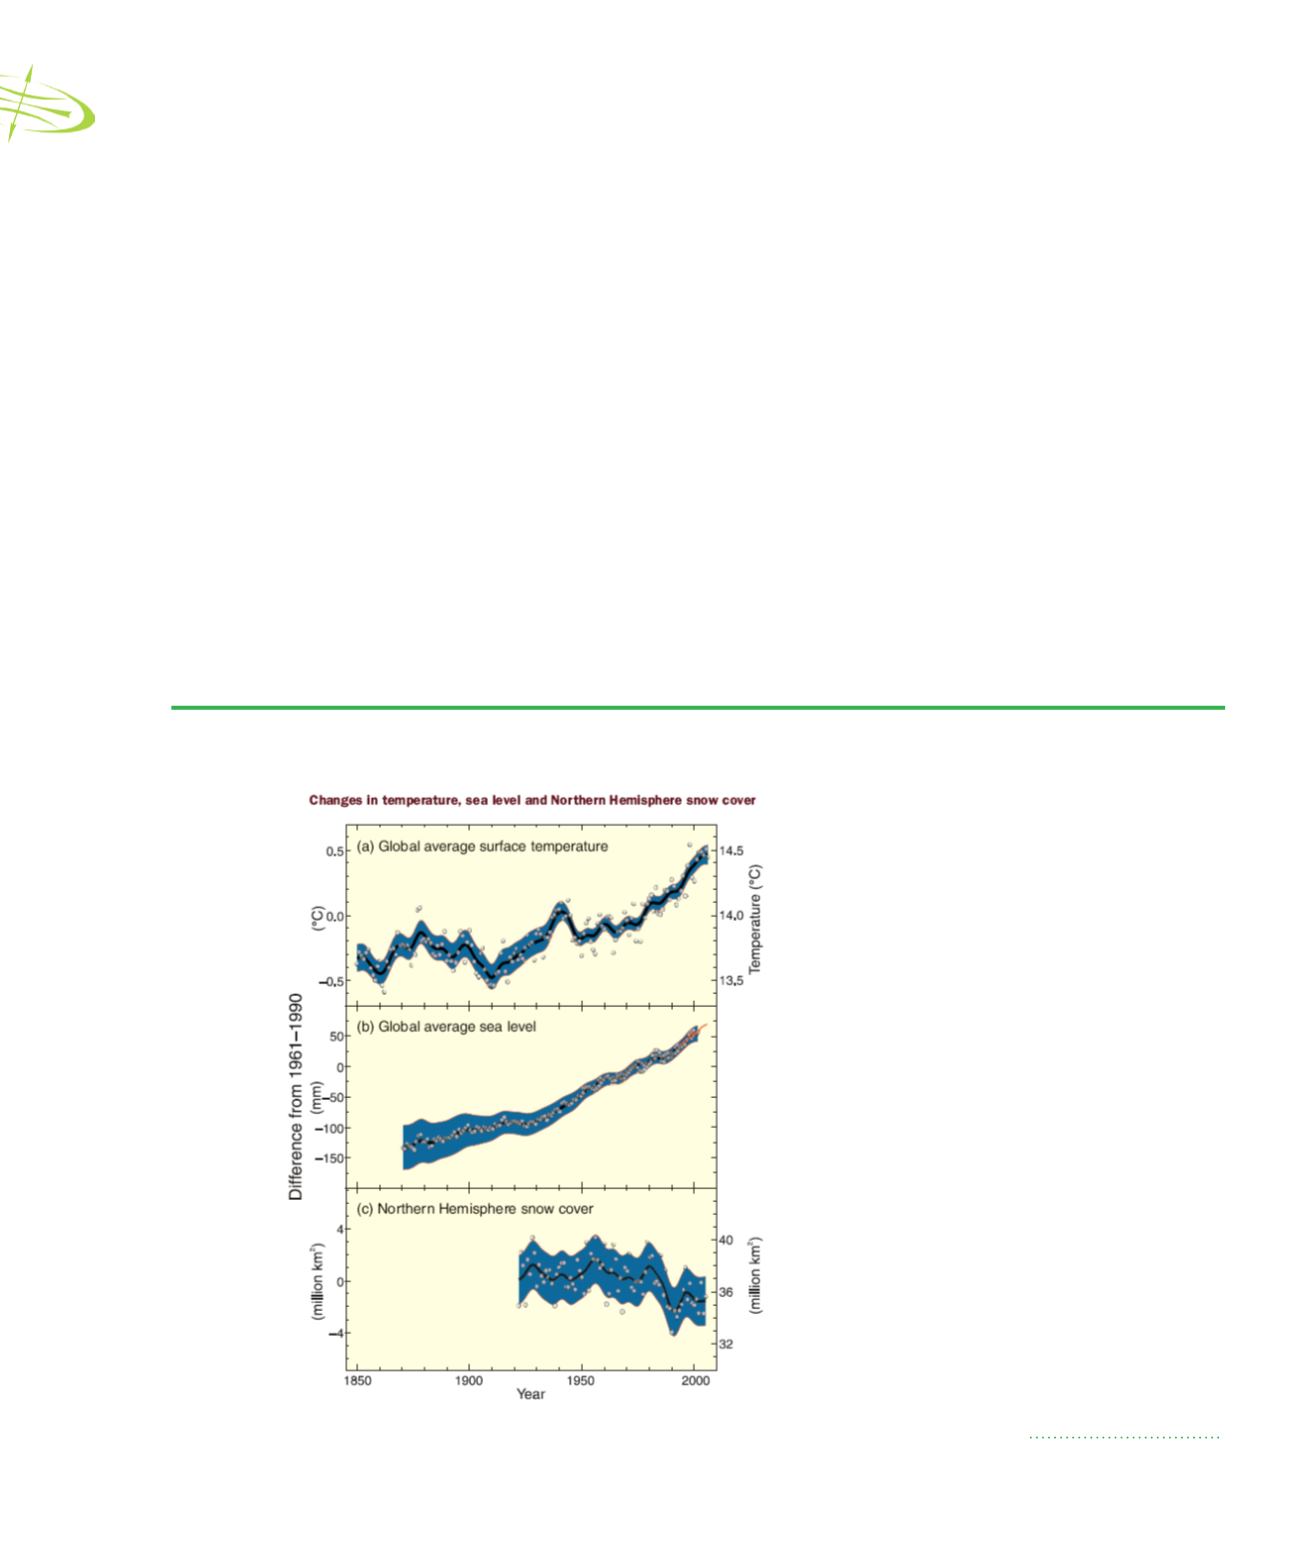
FIGURE 7.1
Observed changes
Source: IPCC, 2007
reports (INTERGOVERNMENTAL PANEL ON CLIMATE
CHANGE, 2012). Its most recent report to date, the
AR-4 (IPCC, 2007) is based on 29,000 series of data
corresponding to 75 studies, each one with at least 20
years of observation. According to the 4th IPCC report,
the warming of the climate system is unequivocal,
evidenced by observations of increased global average
air and ocean temperatures and by melting glaciers
and rising global average level of the oceans, as shown
in Figure 7.1.
The rise in sea level is consistent with global
warming. The sea level increased at an average rate
of 1.8 mm per year between 1961 and 2003, and
at an average rate of 3.1mm per year between 1993
and 2003. The thermal expansion of the oceans has
contributed to the increase of sea levels, along with the
reduction of the glaciers and ice caps.
The reductions observed in the areas covered by
snow and ice are also consistent with the warming. The
satellite data, since 1978, show that annual average
area of the sea arctic ice has been reduced by 2.7% per
decade, with more intense reductions in the summer,
of 7.4% per decade. The glacial mountains and the
mean snow covers have decreased at both hemispheres.
Temperatures at the top of the permafrost layer have
generally increased since the 1980s in the Arctic by
up to 3°C.
Observed changes in (a) global average
surface temperature; (b) global
average sea level from tide gauge
(blue) and satellite (red) data; and
(c) Northern Hemisphere snow cover
for March-April. All differences are
relative to corresponding averages for
the period 1961-1990. Smoothed
curves represent decadal averaged
values while circles show yearly
values. The shaded areas are the
uncertainty intervals estimated from
a comprehensive analysis of known
uncertainties (a and b) and from the
time series (c).