


 180 / 231

Brasil
PackTrends
2020
180
sustainability & ethics
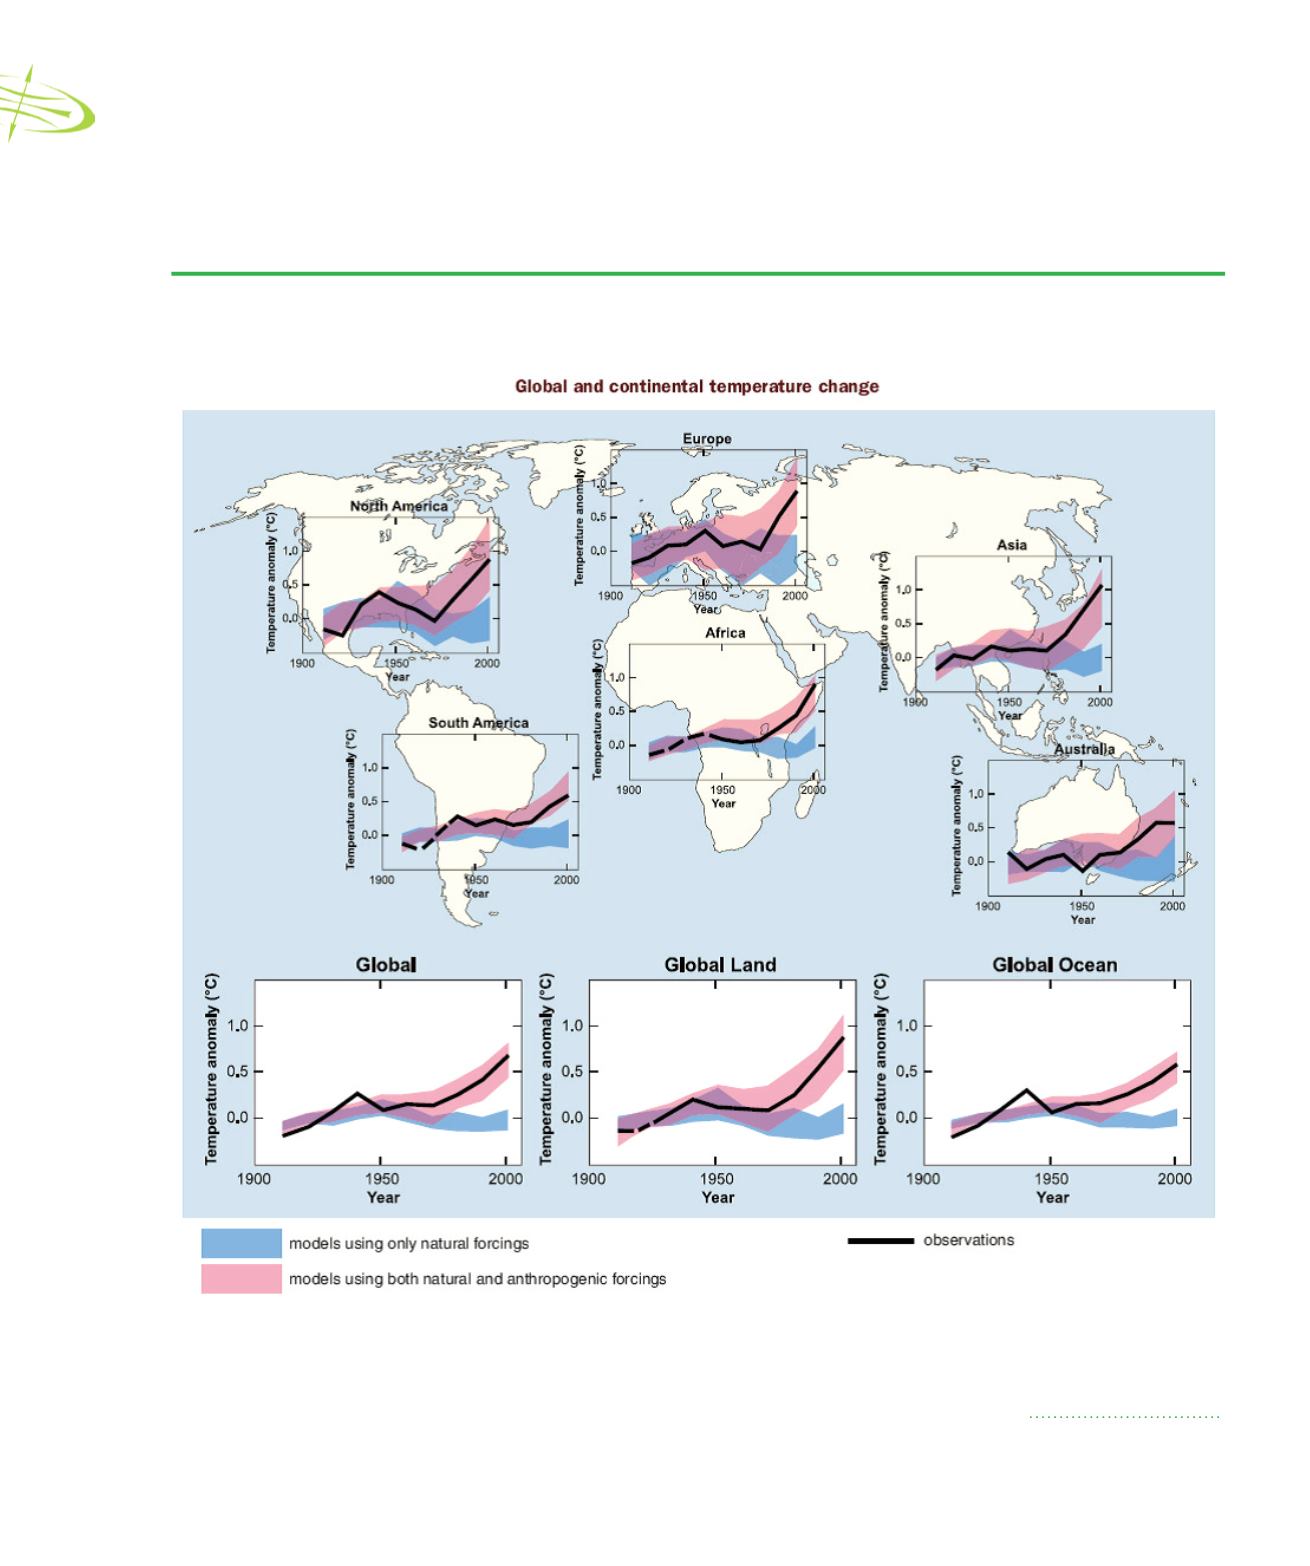
FIGURE 7.3
Changes in temperature
Comparison of observed continental- and global-scale changes in surface temperature with results simulated by climate models using
either natural or both natural and anthropogenic forcings. The black line represents real mean values of the period.
Source: IPCC, 2007