


 30 / 231

Brasil
PackTrends
2020
30
packaging market: world and Brazil
PET bottles, due to the excellent acceptance of the new
format by the consumer, to a product that, over the last
15 years, was sold, mainly, in 1 liter aseptic cartons,
mainly as a result of the better product appearance due
to the packaging.
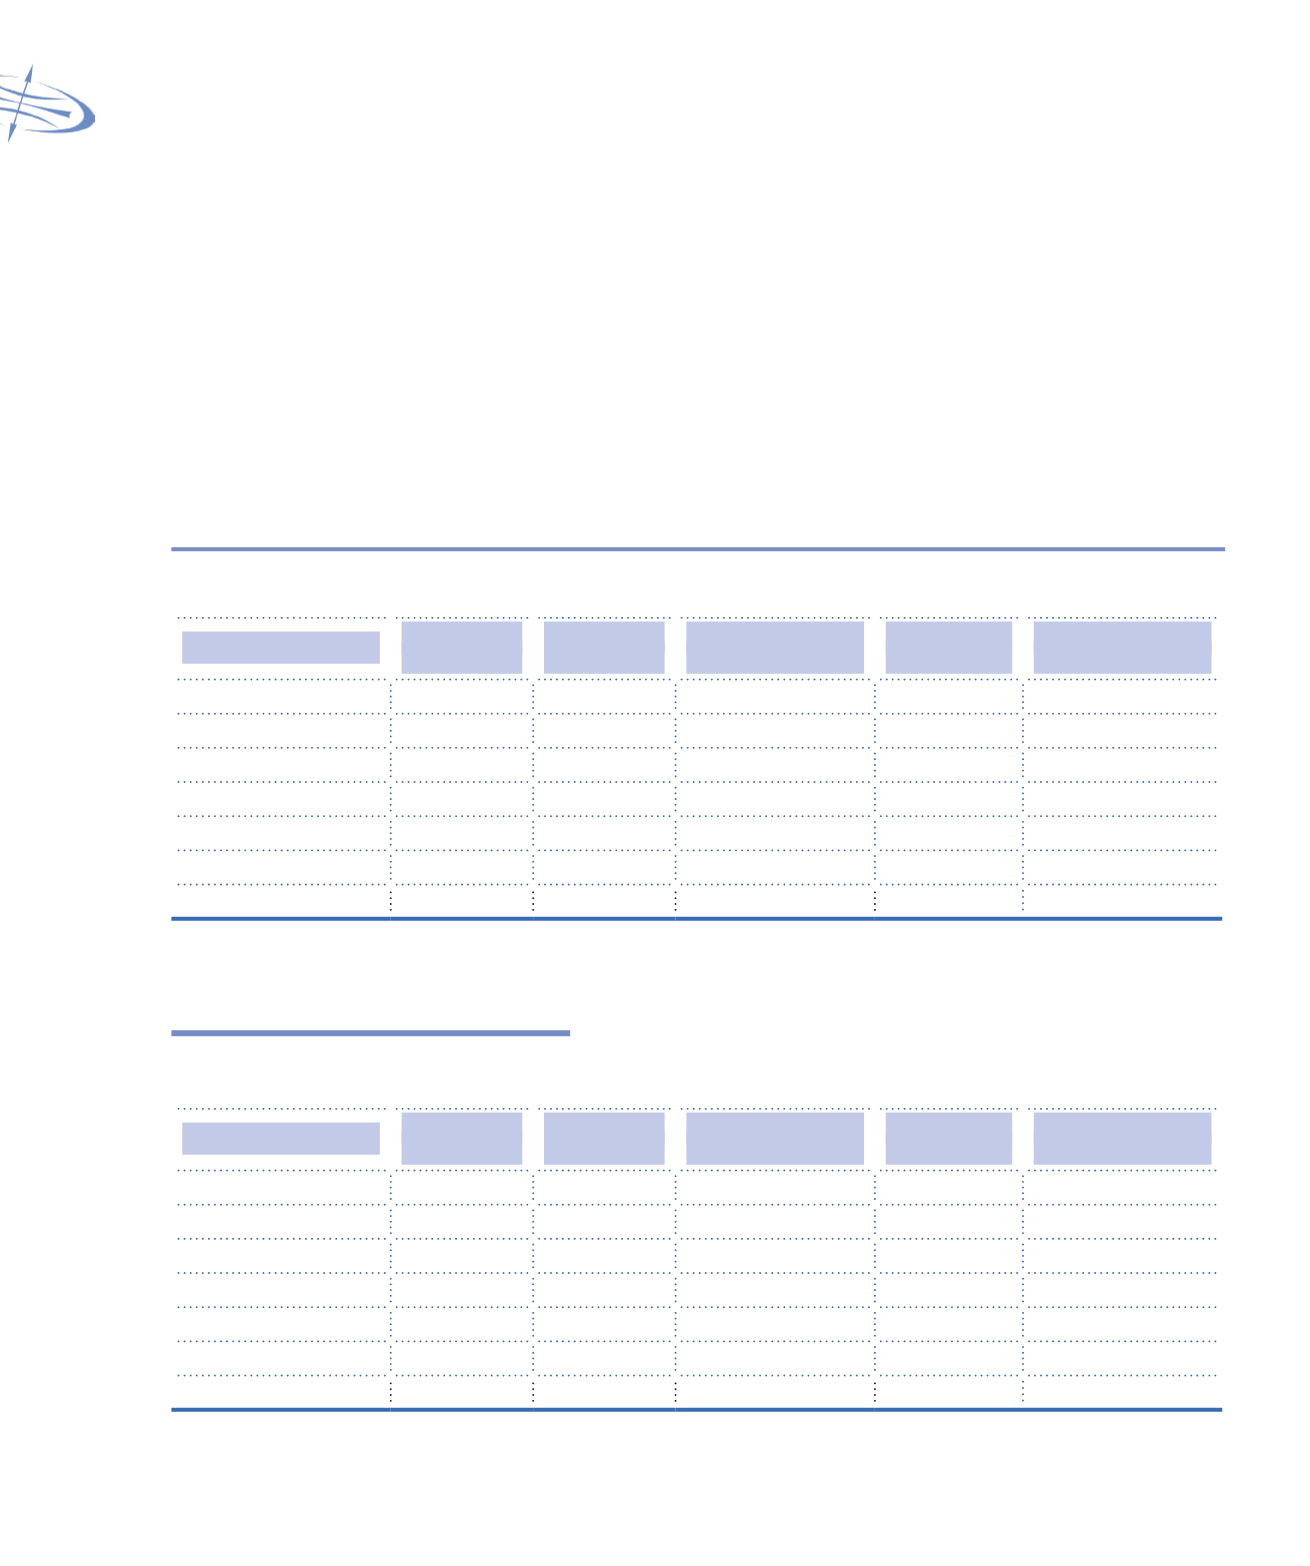
The beverage industry segment should increase
packaging consumption, at average rates of 5.4%
a year, in value (US$ millions), and 4.9% in volume
(tonnes), between 2011 and 2015. Metals, plastics,
paper & board packaging should show the higher growth
rates (
Tables 1.48, 1.49 and 1.50
) (DATAMARK, s.d.).
Table 1.48
Historical trends and projections for beverage packaging consumption: Value
Material
US$ million
2007
US$ million
2011
Average growth
2007-2011
US$ million
2015*
Average growth
2011-2015*
Plastics
2,290
3,940
14.5%
4,905
5.6%
Metals
1,938
3,046
12.0%
3,795
5.7%
Flexibles
1,108
1,523
8.3%
1,861
5.1%
Paper
947
1,329
8.8%
1,654
5.6%
Corrugated board
616
834
7.9%
1,016
5.0%
Glass
562
815
9.7%
927
3.3%
TOTAL
7,462
11,486
11.4%
14,158
5.4%
*Estimate
Source: DATAMARK
Table 1.49
Historical trends and projections for beverage packaging consumption: Volume
(units)
Material
Billion units
2007
Billion units
2011
Average growth
2007-2011
Billion units
2015*
Average growth
2011-2015*
Glass
2.0
2.8
8.8%
3.3
3.8%
Plastics
31.4
45.4
9.6%
57.0
5.9%
Corrugated board
0.5
0.7
7.4%
0.8
4.8%
Metals
43.9
56.1
6.3%
69.1
5.4%
Paper
12.7
15.3
4.8%
19.0
5.6%
Flexibles
34.0
43.3
6.2%
53.6
5.5%
TOTAL
124.5
163.5
7.1%
202.9
5.5%
*Estimate
Source: DATAMARK