


 28 / 231

Brasil
PackTrends
2020
28
packaging market: world and Brazil
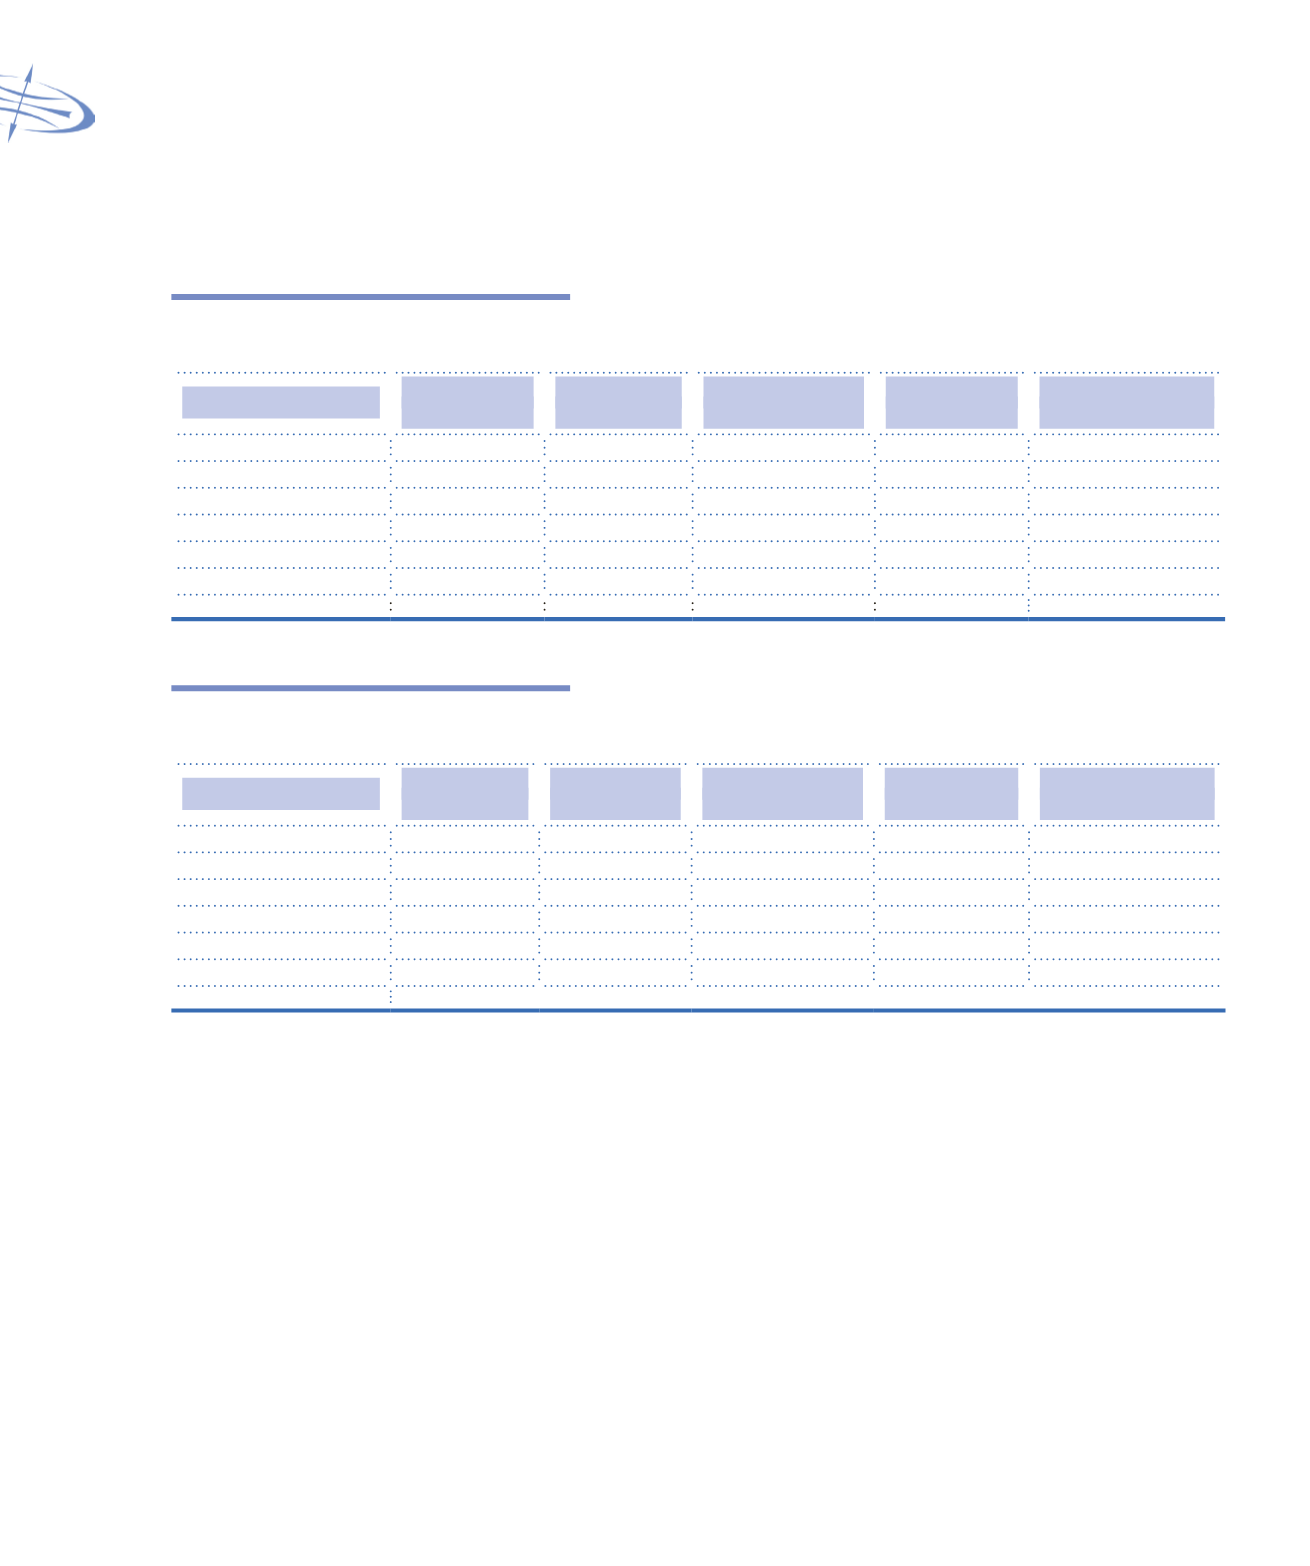
Table 1.45
Historical trends and projections for food packaging consumption:
Volume (units)
Material
Billion units
2007
Billion units
2011
Average growth
2007-2011
Billion units
2015*
Average growth
2011-2015*
Corrugated board
6.2
7.0
3.4%
8.6
5.2%
Plastics
83.7
94.8
3.2%
107.3
3.1%
Metals
8.3
8.0
-0.8%
9.7
5.0%
Paper and board
14.0
16.5
4.2%
18.5
2.9%
Glass
1.2
1.1
-1.4%
1.2
3.1%
Flexibles
94.1
103.6
2.4%
115.9
2.9%
TOTAL
207.4
230.9
2.7%
261.2
3.1%
*Estimate
Source: DATAMARK
Table 1.46
Historical trends and projections for food packaging consumption:
Volume (tonnes)
Material
Billion units
2007
Billion units
2011
Average growth
2007-2011
Billions units
2015*
Average growth
2011-2015*
Corrugated board
1,229.0
1,415.2
3.6%
1,666.2
4.2%
Plastics
558.0
633.3
3.2%
769.5
5.0%
Metals
432.8
390.9
-2.5%
478.9
5.2%
Paper and board
312.0
359.8
3.6%
404.0
2.9%
Glass
189.2
170.3
-2.6%
190.1
2.8%
Flexibles
142.0
155.4
2.3%
179.8
3.7%
TOTAL
2,863.0
3,124.9
2.2%
3,688.9
4.2%
*Estimate
Source: DATAMARK
Beverage industry sales in Brazil reached R$ 151
billion in 2011, an advance of less than 0.9% in relation
to the previous year, way below the growth registered
in 2010 (6.1%). The low growth was due to the poor
performance of the beer segment which retracted
in 2011. One of the factors was an increase in PIS/
Cofins and IPI taxes, by about 15%, over beverages,
that resulted in a price increase of 1.3%. The higher
tax burden had an impact on the sector, especially on
brands with lower market shares. However, some sectors
maintained the good sales performance of previous
years, such as tonic drinks, pulled up by energy drinks
(33%) and isotonics (30%), and fruit juices (15%).
Table 1.47 shows the main products in this segment,
by sales, for the period of 2008-2011.
User industry: beverages