


 23 / 231

Brasil
PackTrends
2020
23
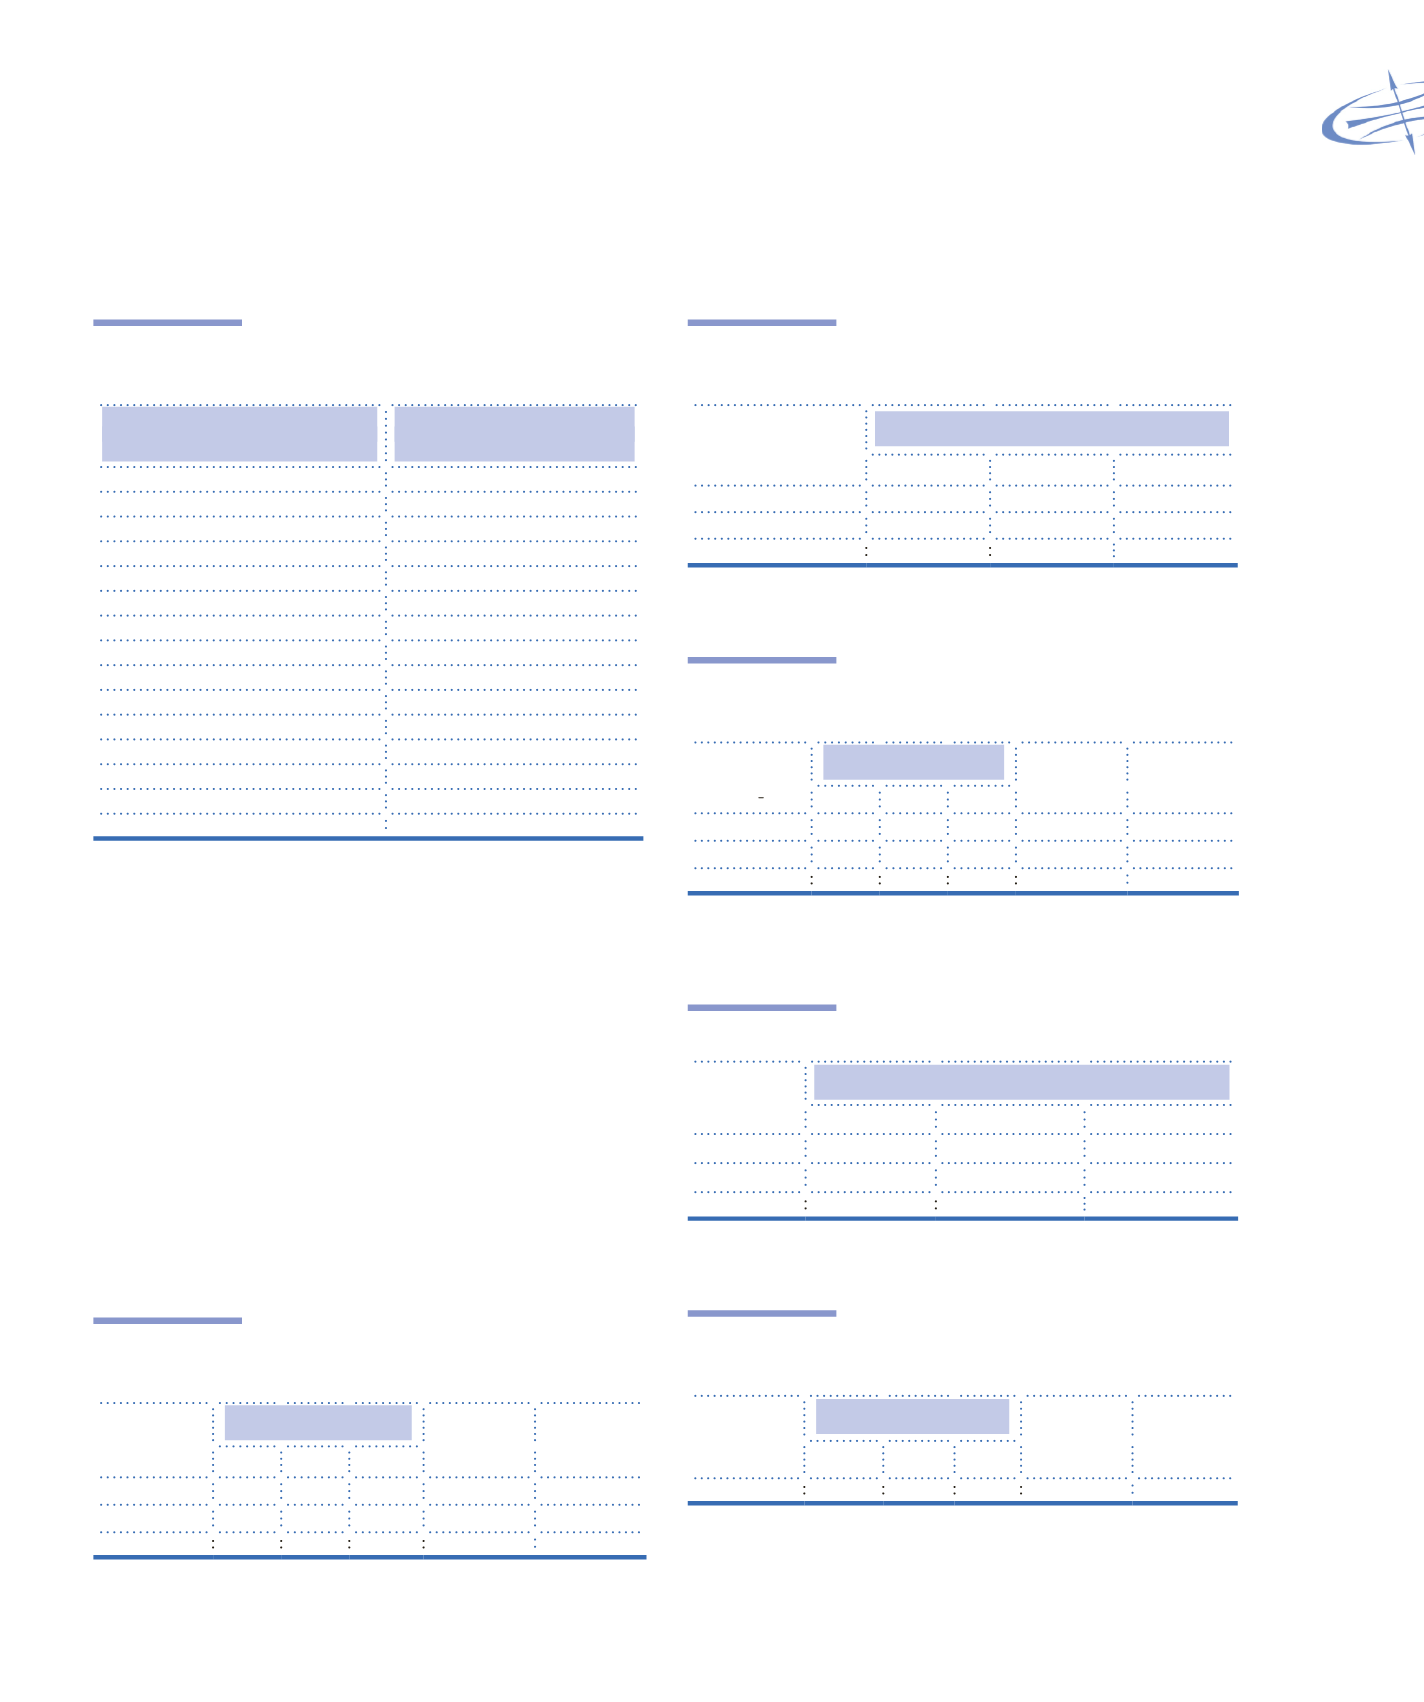
packaging market: world and Brazil
Chart 1.3
The 15 biggest national markets of
metallic packages consumption
Principal 15
Aluminum markets
Principal 15
tinplate markets
Beer
Canned corn
Soft drinks
Whole milk powder
Hair colouring
Condensed milk
Deodorants
Emulsion paint
Juices and nectars
Solvents
Energy drinks
Beer
Pharmaceuticals
Soft drinks
RTD tea
Chocolate powder
Aguardente premium
Corned beef
Skin cream
Tomato purée
Hair spray
Skimmed milk powder
Canned olives
Canned peas
Alcopops
Tomato sauce
Shaving foam
Aerosol insecticides
Hair straightening products
Palm hearts
Source: DATAMARK
In the period of 2007-2011 there was high growth
in beverage can consumption, with an annual rate of
9.7% for aluminum packaging and 5.4% for tinplate
packaging (
Table 1.32
). Aluminum can consumption
will continue to grow, between 2011 and 2015, despite
taxes being lower in the previous period. The per capita
consumption of aluminum cans increased from 0.9kg,
in 2007, to 1.3, in 2011, and is estimated to reach
1.6kg per capita in 2015 (
Table 1.33
).
Metal packaging for aerosols, despite a lower
proportion consumed in metal packaging, also showed
a considerable increase in the period of 2007-2011
(17.4% a year), and is estimated to grow over 5% a
year, from 2011 to 2015 (
Table 1.34
).
Table 1.32
Consumption of cans for beverages
(tonnes)
Cans for
beverages
Thousand tonnes
2007 – 2011
CAGR
2011-2015*
CAGR
2007 2011 2015
Aluminum 172.8 250.4 312.3
9.7%
5.7%
Tinplate/TFS 26.2 32.3 42.0
5.4%
6.8%
TOTAL
198.9 282.8 354.4
9.2%
5.8%
Estimate*
CAGR: Compound Annual Growth Rate
Source: DATAMARK
Table 1.33
Consumption of cans for beverages
(kg/capita)
Material
kg/capita
2007
2011
2015
Aluminum
0.9
1.3
1.6
Tinplate/TFS
0.1
0.2
0.2
TOTAL
1.0
1.5
1.9
Estimate*
Source: DATAMARK
Table 1.34
Cans and aerosols consumption
(tonnes)
Aerosols and
cans (excl.
beverage cans)
Thousand tonnes
2007 – 2011
CAGR
2011-2015*
CAGR
2007 2011 2015
Aerosols
23.1 43.8 53.5
17.4% 5.1%
Cans
564.5 545.0 658.4 -0.9%
4.8%
TOTAL
587.6 588.9 711.9
0.1%
4.9%
Estimate*
CAGR: Compound Annual Growth Rate
Source: DATAMARK
Table 1.35
Cans and aerosols consumption (kg/capita)
Material
kg/capita
2007
2011
2015
Aerosols
0.1
0.2
0.3
Cans
3.0
2.9
3.4
TOTAL
3.1
3.1
3.7
Estimate*
Source: DATAMARK
Table 1.36
Consumption of metal caps
(units)
Crown caps
Billion units
2007 – 2011
CAGR
2011-2015*
CAGR
2007 2011 2015
TFS
16.9 16.9 20.9
0.1%
4.6%
Estimate*
CAGR: Compound Annual Growth Rate
Source: DATAMARK