


 20 / 231

Brasil
PackTrends
2020
20
packaging market: world and Brazil
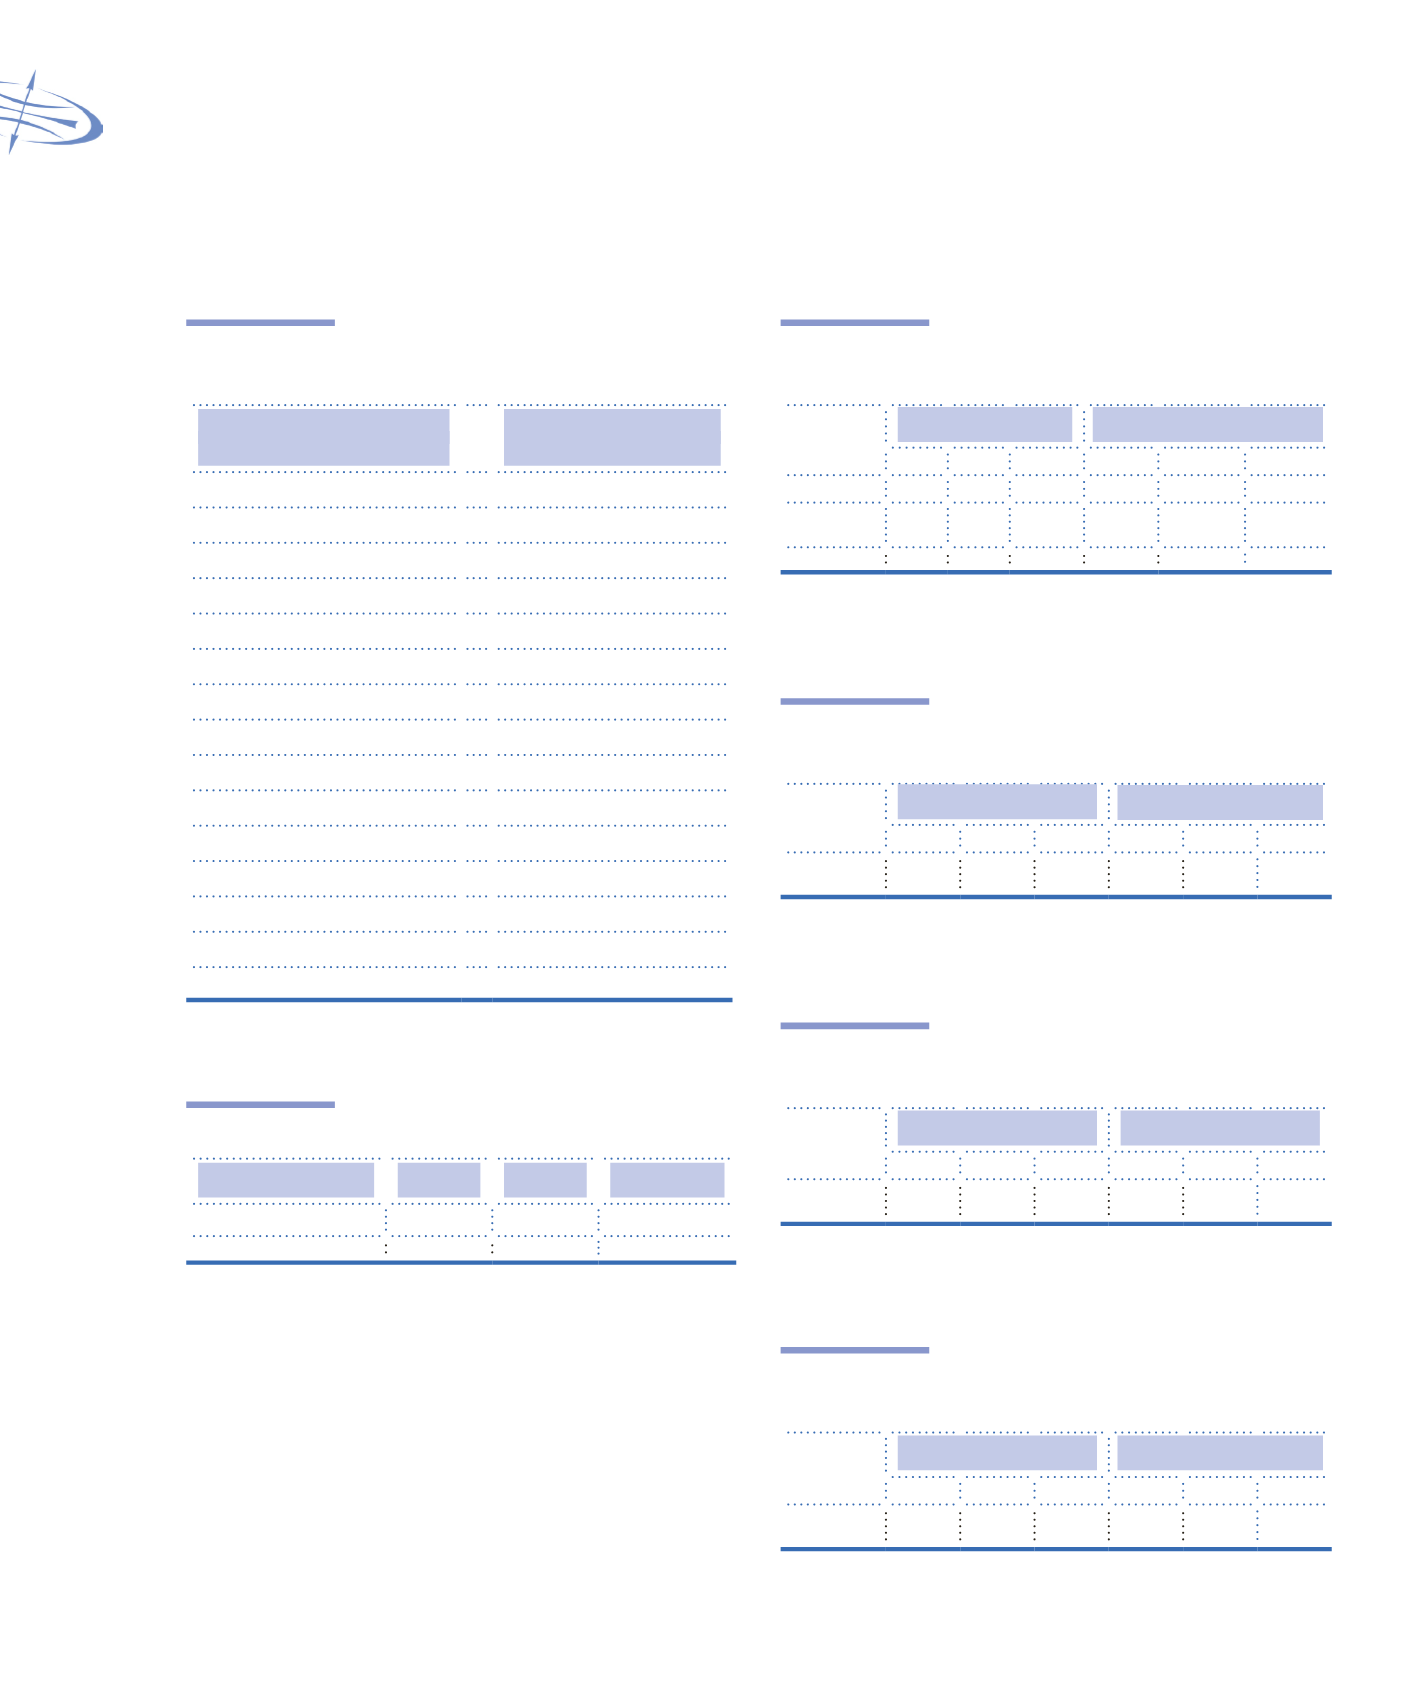
Chart 1.1
The principal 15 plastic packaging
markets in Brazil
Principal 15 markets
flexible plastics
Principal 15 markets
rigid plastics
Biscuits
Soft drinks
Pet food
Mineral water
Powder drinks
Edible oil
Coffee
Chemical products
Snacks
Fabric softeners
Toothpaste
Fruit & vegetables
Tomato sauce
Washing up liquid
Baking mix
Hair conditioners
Soft drinks
Bleach
Chewing gum
Flavored fruit drinks
Soap
Skin cream
Cigarettes
Agrochemicals
Washing powder
Lubricating oil
Chilled boneless beef
Yogurt
Dry pasta
Alcohol
Source: DATAMARK
Table 1.19
Plastics consumption (kg per capita)
Material
2007 2011
2015*
Plastics
9.5
11.6
14.4
Flexible plastics
1.4
1.6
1.9
*Estimate
Source: DATAMARK
With regard to plastic packaging, there was
substantial growth in all segments, especially PET
bottles (43% in units and 34.8% in tonnes) and plastic
bottle caps (32% in units and 25.8% in tonnes) 2007-
2011. This trend will continue, the estimated increase
in volume is approximately 22% for PET bottles, 23%
for plastic bottles, 17% for flexible packaging, 23% for
plastic caps and 20% for plastic labels, from 2011 to
2015 (
Tables 1.20 to 1.23
).
Table 1.20
Plastic and PET bottles consumption
(units volume)
type
Billion units
Thousand tonnes
2007 2011 2015* 2007 2011 2015*
PET bottles 12.3 17.6 21.6 501.1 675.8 824.4
Plastic
bottles
8.1 10.7 13.6 273.4 324.9 401.1
Total
20.4 28.3 35.3 774.6 1,000.8 1,229.6
*Estimate
Source: DATAMARK
Table 1.21
Flexible packaging consumption
(units volume)
type
Billion units
Thousand tonnes
2007 2011 2015* 2007 2011 2015*
Flexible
Packages
126.4 139.0 156.8 230.4 259.6 303.5
*Estimate
Source: DATAMARK
Table 1.22
Plastic caps consumption
(units volume)
type
Billion units
Thousand tonnes
2007 2011 2015* 2007 2011 2015*
Plastic
caps
25.9 34.2 42.1 102.9 129.5 160.2
*Estimate
Source: DATAMARK
Table 1.23
Plastic labels consumption
(units volume)
type
Billion units
Thousand tonnes
2007 2011 2015* 2007 2011 2015*
Plastic
labels
24.6 30.5 37 33.9 34.4 41.5
*Estimate:
Source: DATAMARK