


 22 / 231

Brasil
PackTrends
2020
22
packaging market: world and Brazil
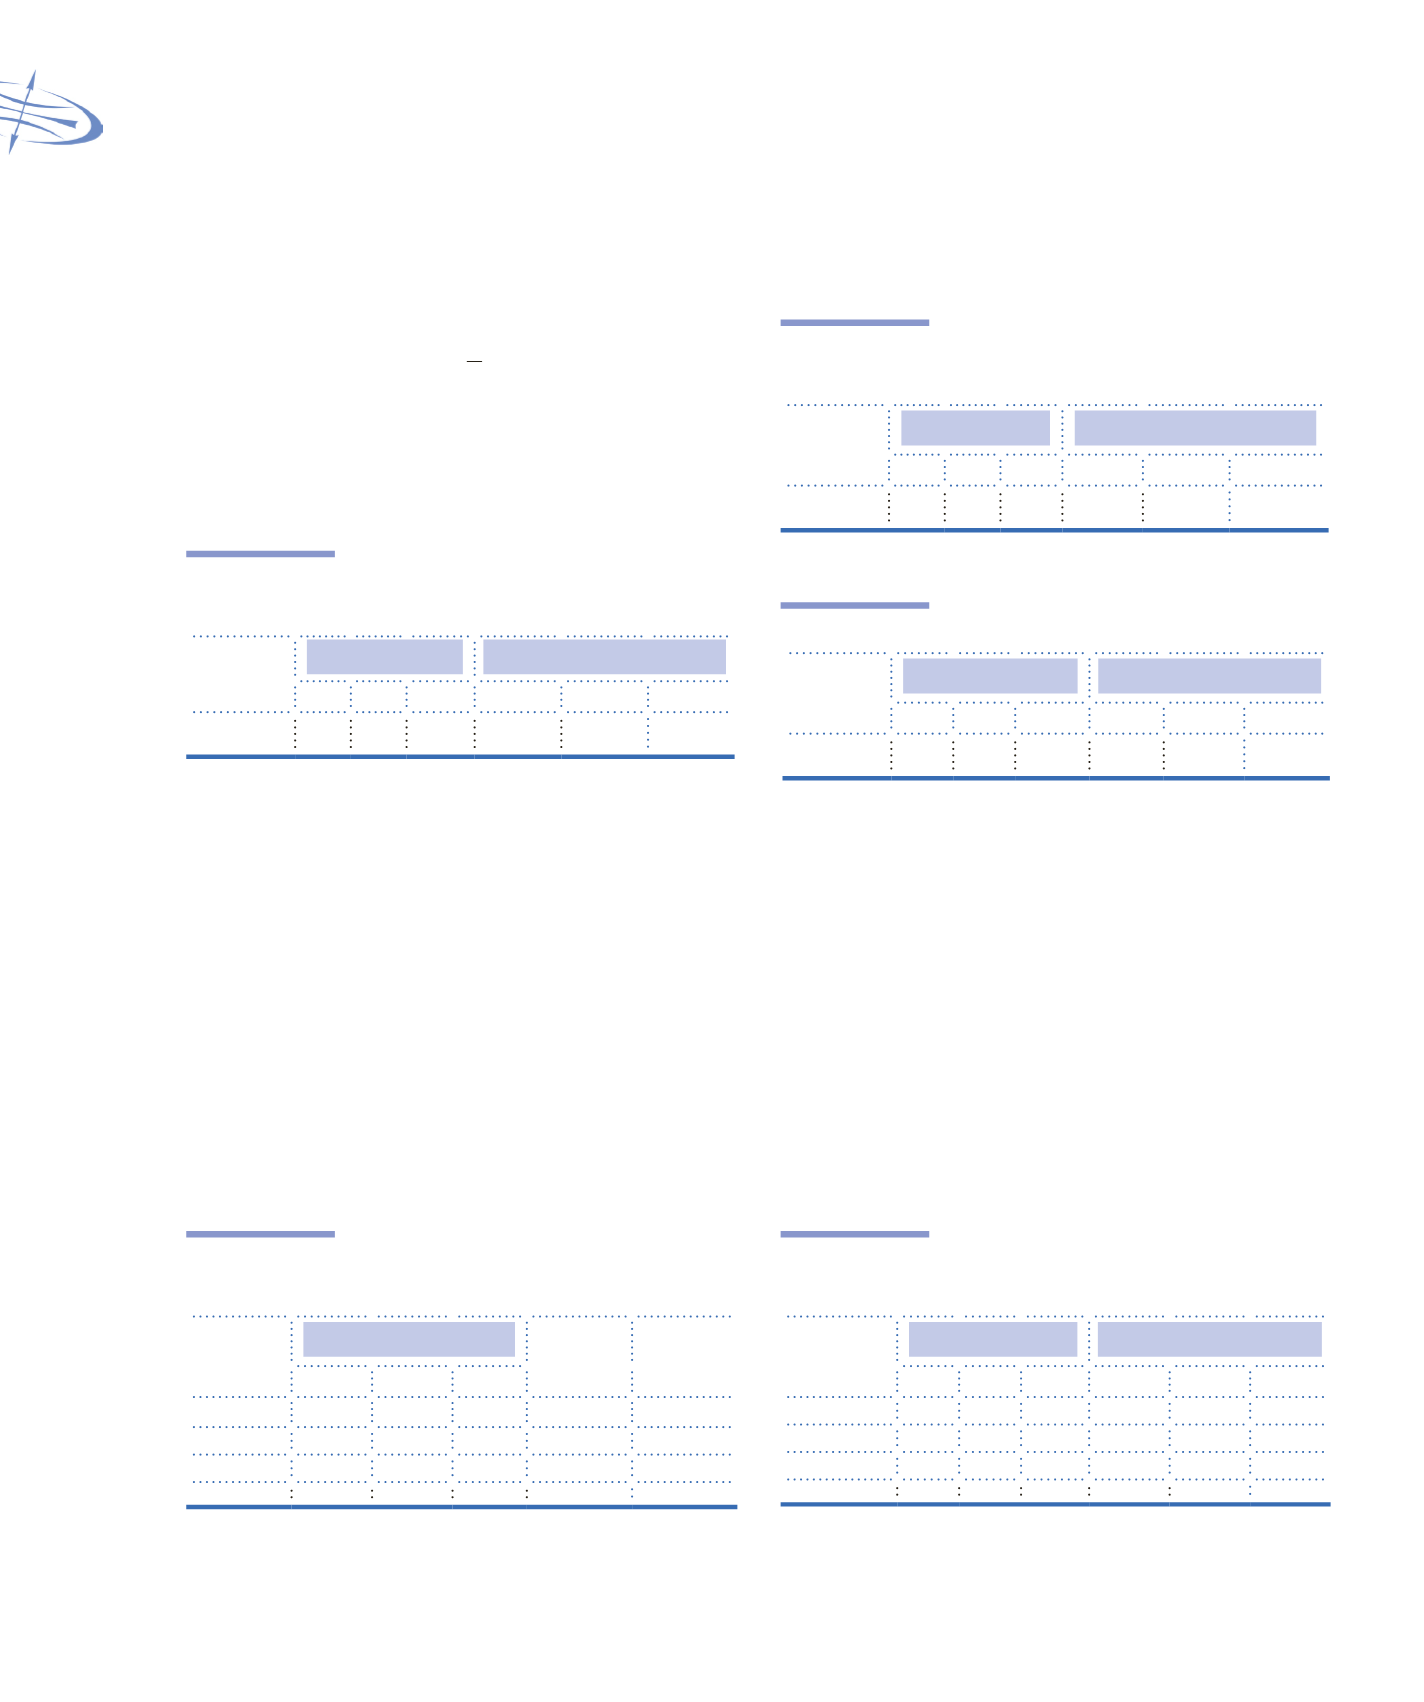
As to cellulose packaging the principal
consumption is corrugated board, which will reach
over 3.7 million of tonnes in 2015 (
Table 1.27
). In
the period of 2011-2015, an increase of about 15%
is estimated for Corrugated board, 13% for paperboard
cartons (
Table 1.28
) and 15% for paper labels (
Table
1.29
).
Table 1.27
Corrugated board boxes consumption
(units volume)
Material
Billion units
Thousand tonnes
2007 2011 2015* 2007
2011 2015*
Corrugated
board
29.1 36.6 41.6 2,839.2 3,245.2 3,747.5
*Estimate:
Source: DATAMARK
Table 1.28
Paperboard packaging consumption
(units volume)
Material
Billion units
Thousand tonnes
2007 2011 2015* 2007 2011
2015*
Paperboard
cartons
27.4 31.2 35.0 494.1 621.1
695.2
*Estimate:
Source: DATAMARK
Table 1.29
Paper labels consumption (units volume)
Material
Billion units
Thousand tonnes
2007 2011 2015* 2007 2011 2015*
Paper
labels
26.9 29.7 24.6 27.3 28.4
32.8
*Estimate:
Source: DATAMARK
Metal packaging
The metal packaging market showed high growth
in the period of 2007-2011 (
Table 1.30
), with an
annual rate above 10% in value (US$). For 2011 and
2015, the forecast is an increase in volume of about
5% for steel packaging, 25% for aluminum and 21%
for tinplate (
Table 1.31
).
Table 1.30
Size of the metal packaging market:
Value (historical trends and projections)
Material
US$ millions
2007 – 2011
CAGR
2011-2015*
CAGR
2007 2011 2015
Steel
546.5 577.2 608.9 1.37% 1.35%
Aluminum 1,900.7 3,003.5 3,751.6 12.1% 5.7%
Tinplate/TFS 1,864.7 2,783.2 3,367.5 10.4% 1.3%
TOTAL
4,311.8 6,363.8 7,727.9 10.2% 5.0%
Estimate*
CAGR: Compound Annual Growth Rate
Source: DATAMARK
Amongst the major end use markets for metal
packaging, the following standout: beer, soft drinks,
hair coloring, deodorants, juices and nectars for
aluminum packaging, and canned corn, whole milk
powder, condensed milk, emulsion paint and solvents
for tinplate packaging (
Chart 1.3
).
Table 1.31
Size of the metal packaging market:
Volume (historical trends and projections)
Material
Billion units
Thousand tonnes
2007 2011 2015* 2007 2011 2015*
Steel
0.02 0.03 0.03 278.6 282.2 297.7
Aluminum 26.9 39.0 48.6 252.4 370.9 463.3
Tinplate/TFS 28.6 29.7 35.5 681.9 685.7 829.7
TOTAL
55.5 68.7 84.2 1,212.9 1,338.8 1,590.6
*Estimate
Source: DATAMARK