


 24 / 231

Brasil
PackTrends
2020
24
packaging market: world and Brazil
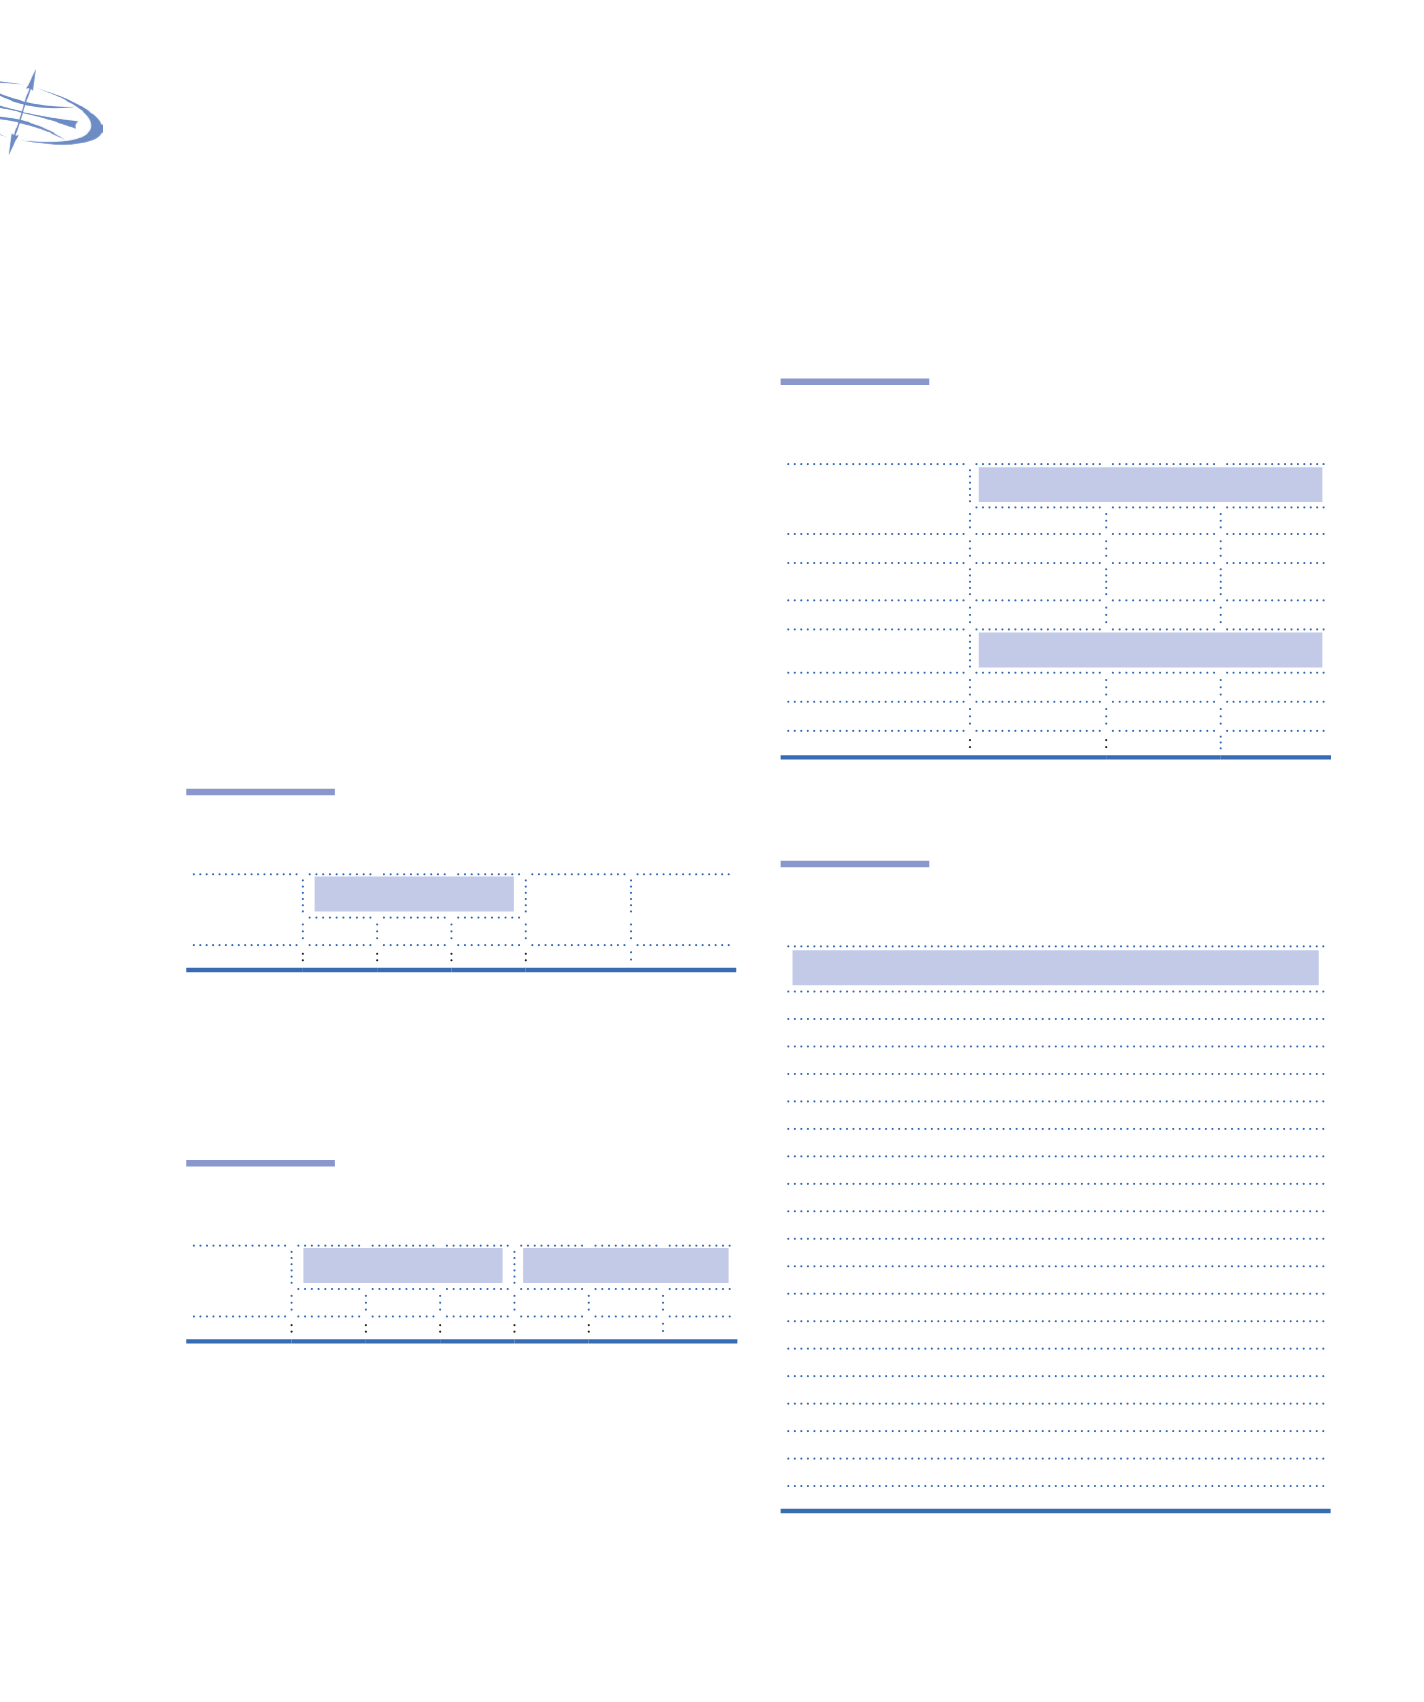
The market of glass packaging grew at an annual
rate of 8.9% in value (US$), from 2007 to 2011 (
Table
1.37
). The forecast for 2015 is that the market will
reach 8.6 billion units, equivalent to 1.3 million tonnes
(
Table 1.38
). The consumption of one-way bottles more
than doubled in volume (tonnes), in the period of 2007-
2011 (
Table 1.39
).
Beverages are amongst the most common end
uses of this type of packaging, as well as pharmaceutical
products and food (
Chart 1.4
).
Table 1.37
Size of the glass packaging market:
Value (historical trends and projections)
Material
US $ Millions
2007 – 2011
CAGR
2011-2015*
CAGR
2007 2011 2015
Glass
898 1,262 1,433
8.9% 3.2%
Estimate*
CAGR: Compound Annual Growth Rate
Source: DATAMARK
Table 1.38
Size of the glass packaging market:
Units (historical trends and projections)
Material
Billion units
Thousand tonnes
2007 2011 2015* 2007 2011 2015*
Glass
5.5
7.2
8.6 1,012 1,191 1,361
*Estimate
Source: DATAMARK
Table 1.39
Consumption of glass packaging (tonnes,
kg/capita): One-way and returnable
Material
Thousand tonnes
2007
2011
2015*
Returnable bottles
224.8
230.7 264.0
One-way bottles
142.2
296.4 356.5
TOTAL
367.0
527.1 620.5
kg/capita
2007
2011
2015*
Returnable bottles
1.18
1.21
1.38
One-way bottles
0.74
1.55
1.87
*Estimate
Source: DATAMARK
Chart 1.4
Principal 20 Brazilian markets for
glass packaging
Principal 20 markets for glass packaging
Beer
Cognac
Pharmaceuticals
Fragrances
Table wine
Concentrate fruit juices
Soft drinks
Coconut milk
Aguardente premium
Alcopops
Canned olives
Instant coffee
Aguardente popular
Vodka
Rum
Cider
Corn
Whisky
Quality wine
Source: DATAMARK
Glass packaging