


 18 / 231

Brasil
PackTrends
2020
18
packaging market: world and Brazil
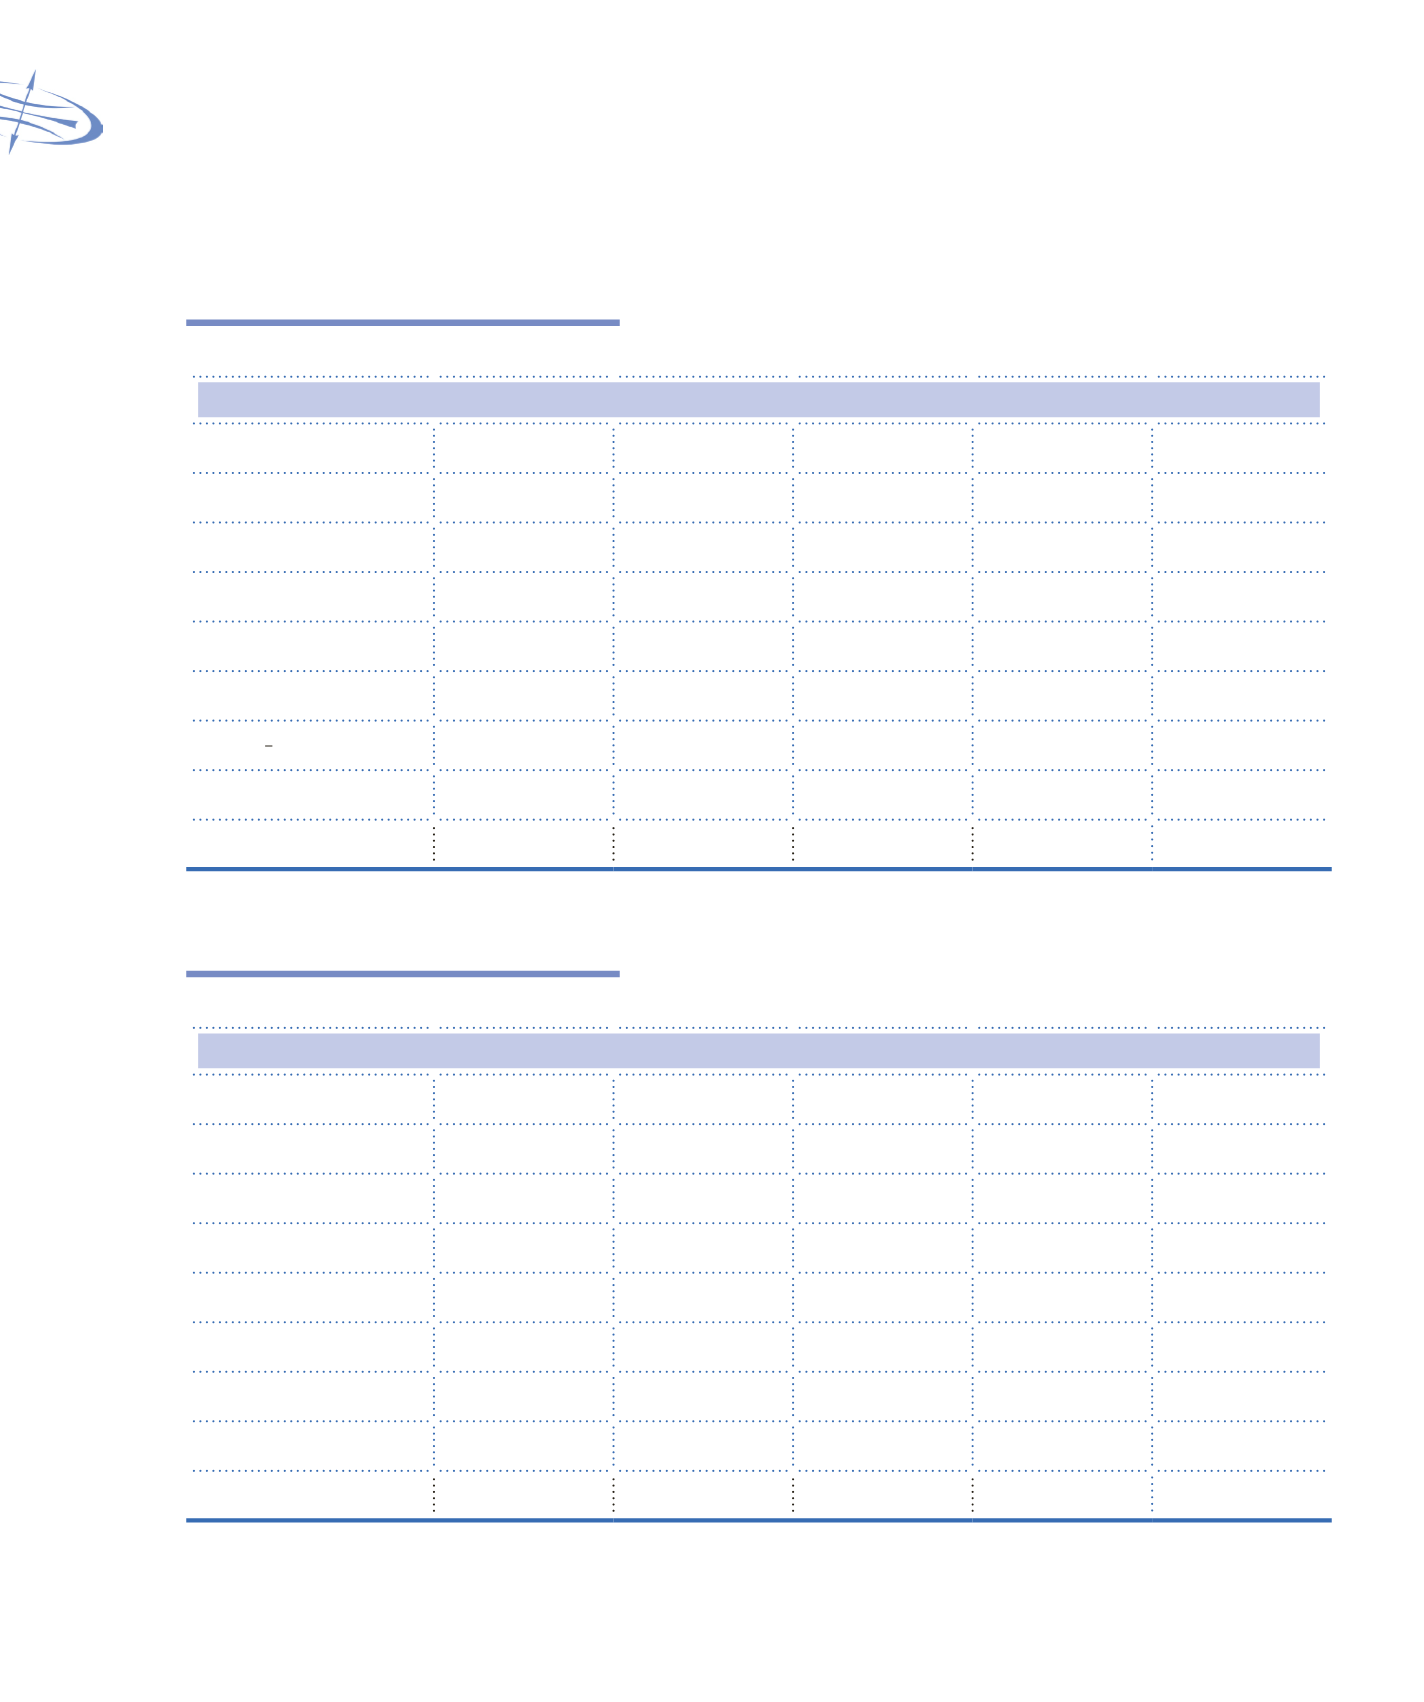
Table 1.15
Packaging recycling in 2010
Packaging recycling index in 2010
Material
Brazil
Japan
Argentina
Europe
USA
Aluminum
97.6%
92.6%
91.1%
64.3%
58.1%
Tinplate
35%
89.4%
-
71%
67%
PET
57.1%
72%
32.7%
48.3%
29%
Plastics
19.4%
77%
28%
30%
20%
Glass
46%
66.5%
-
68%
28%
Aseptic cartons
25%
20%
-
34%
-
Corrugated board
70%
95.5%
45.5%
60%
76.6%
Paperboard
45%
-
23%
78%
35.2%
Source: DATAMARK
Table 1.16
Recycled packaging volume in 2010
Recycled packages volume in 2010 (Thousand tonnes)
Material
Brazil
Japan
Argentina
Europe
USA
Aluminum
239
275
32
304
781
Tinplate
247
612
-
2,600
1,500
PET
282
540
70
1,450
708
Plastics
288
3,087
180
3,960
1,000
Glass
529
404
-
11,543
2,810
Aseptic cartons
77
123
-
350
-
Corrugated board
2,218
9,930
433
15,283
22,760
Paperboard
275
-
-
5,226
1,880
Source: Abal, SRI, Japan Aluminium Association, Tetra Pak, APEAL, Arpet, Abipet, CSN, Plastivida, Napcor, Petcore, PlasticsEurope, ACE, FEVE,
Association of Postconsumer Plastic Recyclers, EPA, JCPRA, Rengo