


 13 / 231

Brasil
PackTrends
2020
13
packaging market: world and Brazil
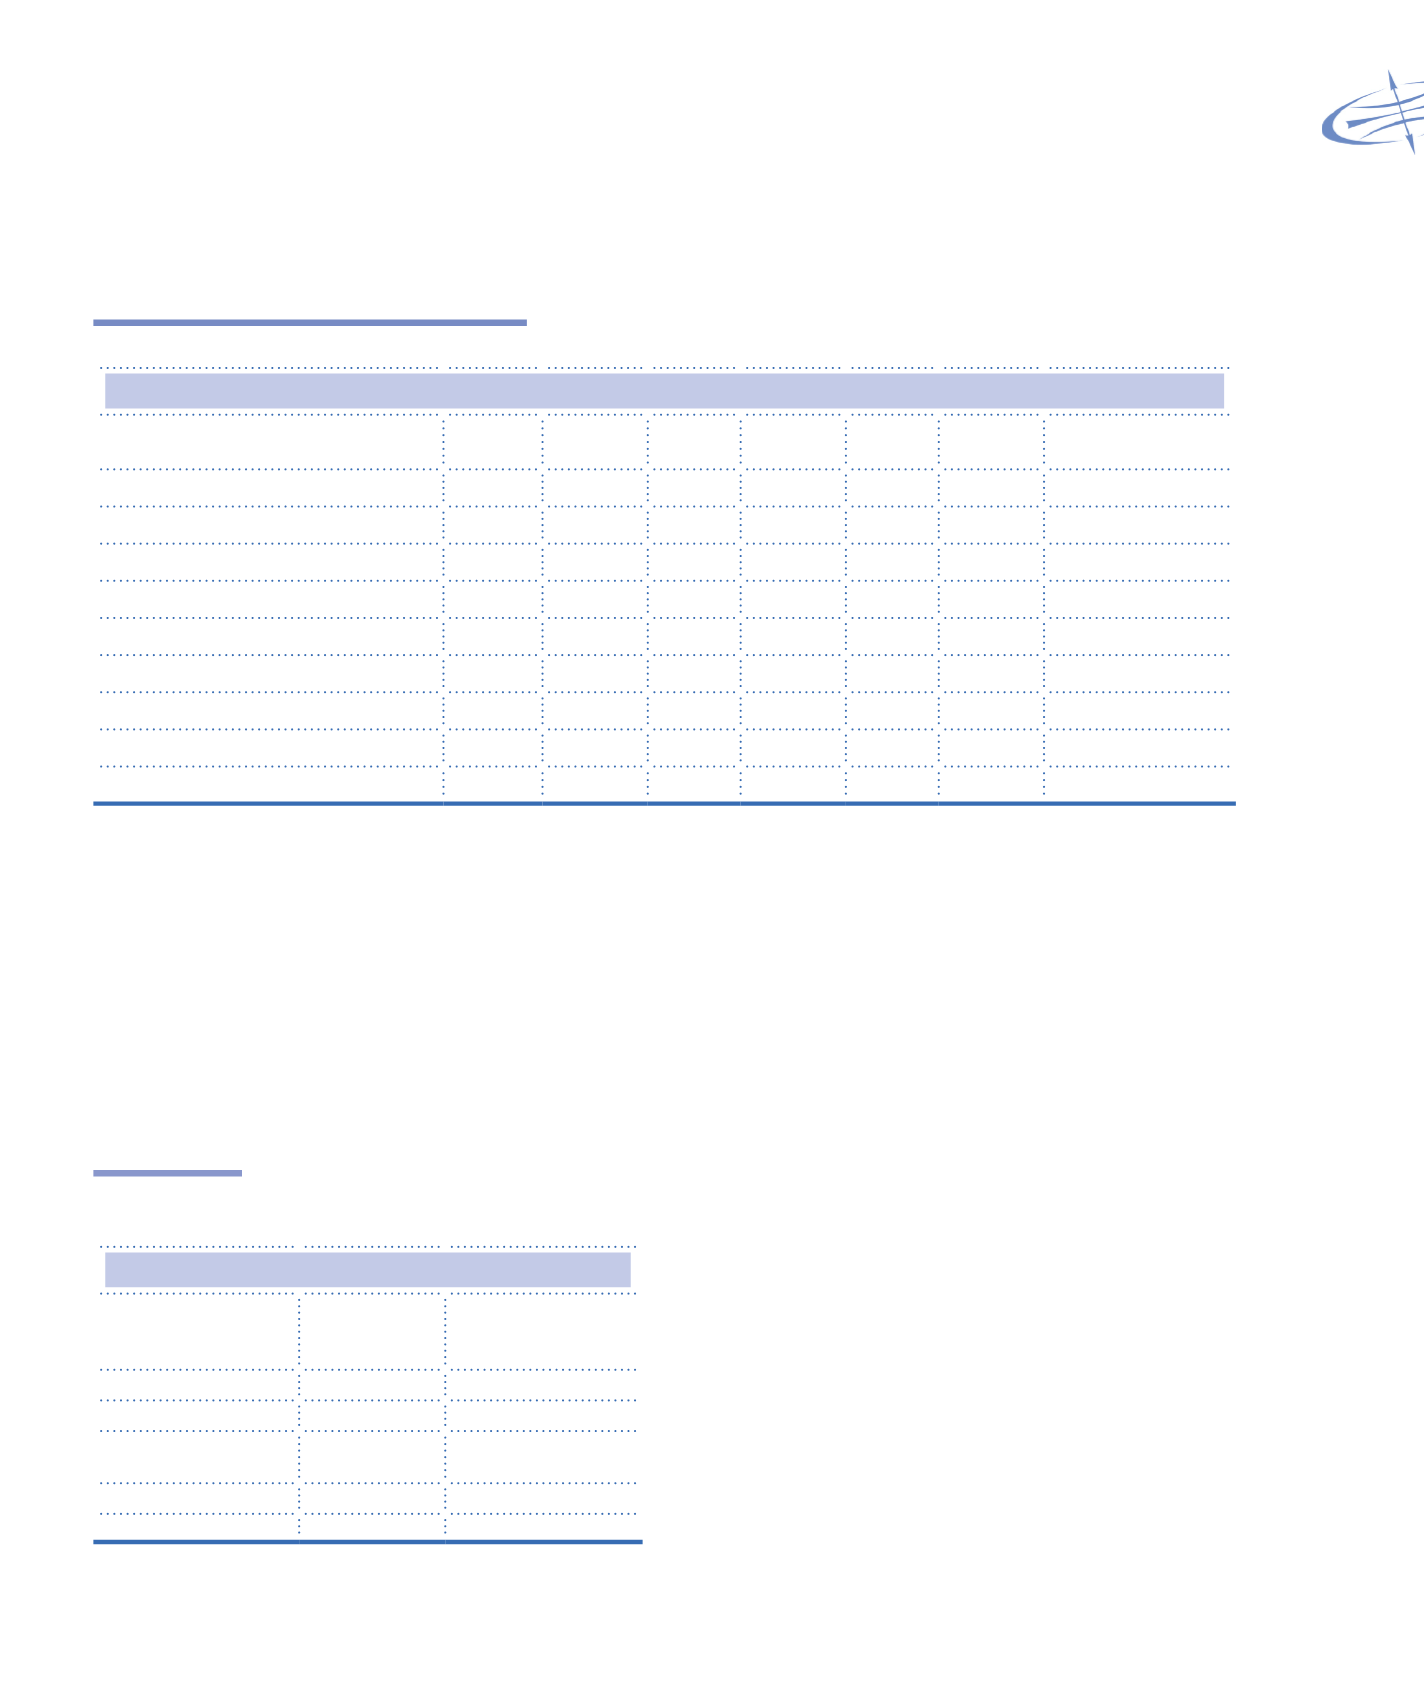
Table 1.3
Packaging sales: Regions (2008, 2001 and projection for 2016)
Packaging sales by region (US$ billion)
Regions
2008 Share
% 2011 Share
% 2016* Share
%
Estimated average
growth 2011-2016
Western Europe
129 23% 142 21% 178 51%
4.6%
Eastern Europe
32
6% 36
5% 51
6%
7.2%
Middle East
23
4% 34
5% 38
4%
2.4%
Africa
16
3% 27
4% 34
4%
2.4%
North America
160 29% 178 26% 206 24%
3.0%
South and Central Americas
45
8% 54
8% 68
8%
4.7%
Asia
145 26% 189 28% 250 30%
5.8%
Oceania
9
2% 16
2% 21
2%
6.2%
TOTAL
559
675
845
*Estimate
Source: DATAMARK, MARKET..., 2008
In relation to the packaging materials used by
industries, the largest participation, in 2010, was from
the Paper & board segment (31%), Plastics (21%)
and Flexibles (19%). For 2015 it is estimated that the
Plastics and Flexibles segments will show higher growth
rates (
Table 1.5
).
Compared to the world market, the Paper & board
segment’s share in Brazil is lower (
Table 1.6
), having
higher proportions for the Plastics (27%), Flexibles
(22%) and Metals (19%) segments.
The definition of the materials showed on Tables
1.5 and 1.6 are:
• Paper & board:
paperboard, corrugated board and
liquid packaging board
• Plastics:
rigid plastic
• Flexibles:
Laminates, wrapping, membranes, bags,
flow pack, stand up pouches, shrink film, stretch
film among other films.
• Others:
Wooden boxes, pallets and woven textile bags.
The largest share of these regions’ sales is
from the Food (51%) and Beverage (18%) sectors.
Pharmaceutical Products, Personal Hygiene and
Cosmetics are the markets that may show the highest
growth rates, between 2010 and 2016 (
Table 1.4
),
although a lower participation on the total sales (6% and
5%, respectively).
Table 1.4
Packaging sales by end user segment:
share in 2010 and projections for 2015
Share and growth by segment
Segment
Share %
2010
Estimated annual
growth
2010-2015
Food
51%
2.8%
Beverages
18%
2.7%
Pharmaceuticals &
Personal hygiene
6%
4.5%
Cosmetics
5%
4.3%
Others
20%
2.6%
Source: REXAM, 2011