


 12 / 231

Brasil
PackTrends
2020
12
packaging market: world and Brazil
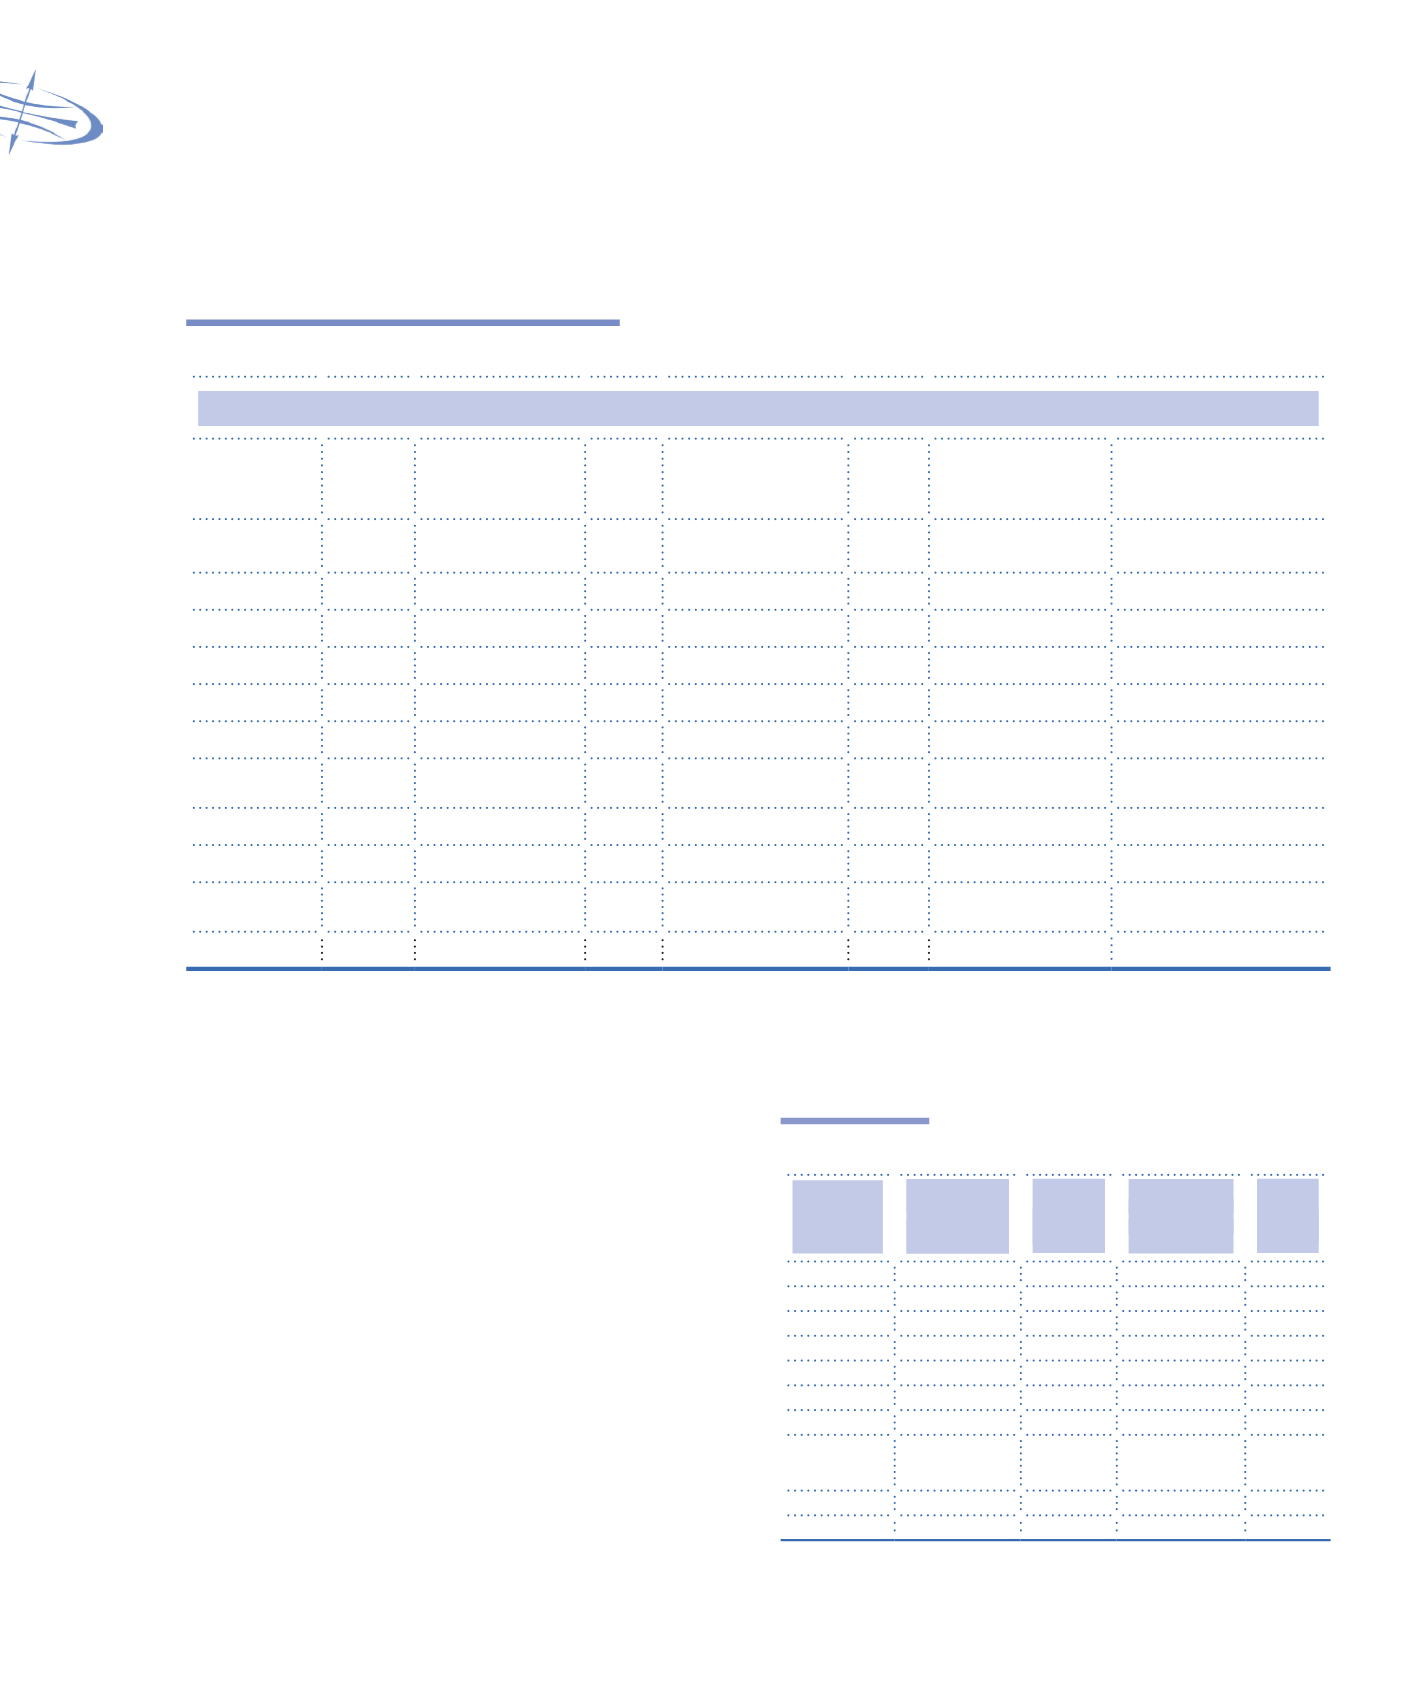
Table 1.1
Packaging sales: Countries (2008, 2011 and projections for 2016)
Packaging sales by country (US$ billion)
Countries
2008
Share
%
2011
Share
%
2016
Share
%
Estimated average
growth 2011-2016
EUA &
Canada
153
27% 168
25% 194
23%
2.9%
China
50
9% 80
12% 117
14%
7.9%
Japan
70
13% 76
11% 87
10%
2.7%
Germany
33
6% 37
5%
42
5%
3.0%
France
27
5% 30
5%
34
4%
2.1%
Brazil
22
3.7% 25
4%
34
4%
6.2%
United
Kingdom
20
4% 22
3%
25
3%
2.6%
Russia
17
3% 21
3%
26
3%
4.9%
India
9
2% 17
3%
25
3%
7.7%
Other
countries
148
26% 187
28% 248
29%
5.8%
TOTAL
559
675
845
Source: DATAMARK, MARKET..., 2008
The increase in disposable personal income in
emerging nations stimulates the demand for a wide range
of products in their own consumer markets, resulting
in the growth of industries that produce packaging for
those goods. For 2016, it is estimated that Brazil’s
share in the world market will increase from 3.7% to
4.0%. The expectation is that China will be confirmed
as the second largest market in the world, with Brazil
rising from the 7
th
to 5
th
position in the ranking, in 2016
(Table 1.2).
Considering different regions, it can be
demonstrated that, according to the Estimates shown
in Table 1.3, the four largest regions for packaging sales
are Asia, North America, Western Europe and Central
and South America.
Table 1.2
The 10 largest packaging markets
Country
Sales
(US$ billion)
2011
Ranking
2011
Sales
(US$ billion)
2016*
Ranking
2016*
USA
141.1
1
163.6
1
China
79.7
2
116.6
2
Japan
76.3
3
87
3
Germany
36.5
4
42.3
4
France
27
5
30.4
7
Canada
27
6
30.8
6
Brazil
25
7
33.8
5
United
Kingdom 22.3
8
25.4
9
Russia
20.5
9
26
8
India
16.9
10
24.5
10
* Estimate
Source: DATAMARK, MARKET..., 2008