


 17 / 231

Brasil
PackTrends
2020
17
packaging market: world and Brazil
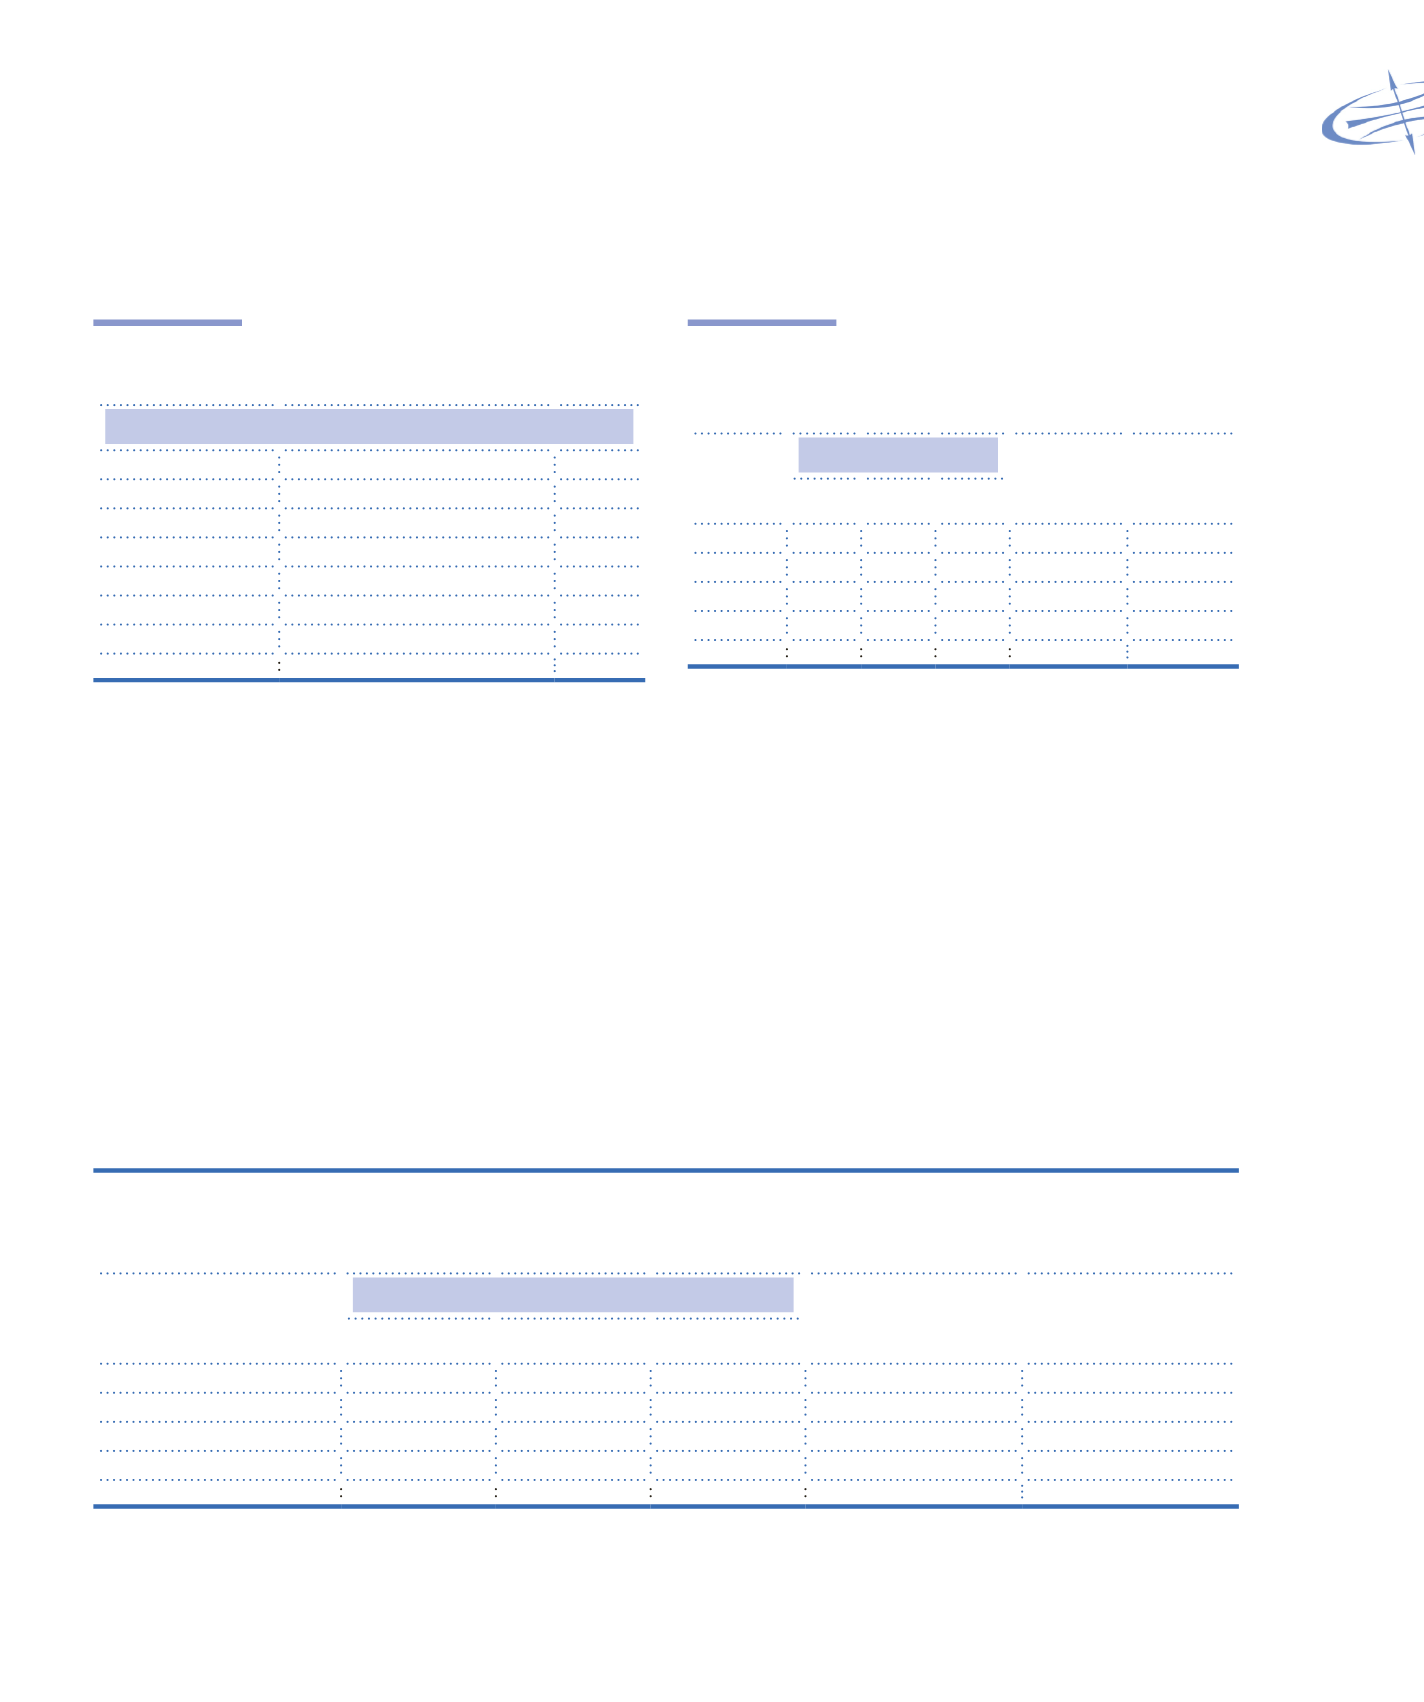
Table 1.12
Employed persons and share by
packaging material
Formal employment in the packaging industry by segment
Segment
Number of registered employees
%
Plastics
117,771
52.8
Corrugated board
35,215
15.8
Paper
30,017
13.3
Metals
18,310
8.2
Wood
14,688
6.6
Glass
6,951
3.1
TOTAL
222,952
Position in 06/31/2012
Source: TABLES, 2010; MINISTRY OF LABOUR AND EMPLOYMENT – MTE
Materials consumption
In 2011, the consumption of packaging was over
9 million tonnes, or US$ 33 million. It is estimated that
the materials consumption will increase to 10.9 million
tonnes (3.9%/ year) for 2015 (
Tables 1.13 and 1.14
).
The consumption of all materials will increase, although
less for plastics and metals, in terms of volume, and for
paper and metals in terms of value.
Table 1.13
Consumption of materials by
segment: Plastics, Cellulose,
Metals and Glass
Material
Million tonnes
2007 – 2011
CAGR
2011-2015*
CAGR
2007 2011 2015
Cellulose 3.7 4.3 4.9 3.8% 3.4%
Plastics
2.1 2.5 3
4.8% 4.8%
Metals
1.2 1.3 1.6 2.5% 4.4%
Glass
1 1.2 1.4 4.2% 3.4%
Total
8 9.3 10.9 3.9% 3.9%
*Estimate
CAGR: Compound Annual Growth Rate
Source: DATAMARK
Packaging recycling in Brazil
According to data from 2010, Brazil stands out
regarding recycling of aluminum packaging, with rates
of over 97%, compared to Japan, USA, Europe and
Argentina. With regard to PET recycling, it is just behind
Japan. As for board recycling, Brazil is ahead of Europe
and Argentina, but behind Japan and USA. Compared
to Japan, it is possible to see that Brazil can achieve
higher recycling rates for plastic packaging, tinplate
and even PET and glass (
Tables 1.15 and 1.16
).
Table 1.14
Consumption of packaging materials in Brazil: Value
(historical trends and projection)
Material
US$ million
2007 – 2011
CAGR
2011-2015*
CAGR
2007
2011
2015
Plastics
12,530
16,995
20,323
7.9%
4.6%
Cellulose
6,640
8,654
11,858
6.8%
8.2%
Metals
4,312
6,364
7,728
10.2%
5.0%
Glass
898
1,262
1,442
8.9%
3.4%
Total
24,381
33,274
41,351
8.1%
5.6%
*Estimate
CAGR: Compound Annual Growth Rate
Source: DATAMARK