


 47 / 231

Brasil
PackTrends
2020
47
fatores que influenciam o mercado de bens de consumo
TABLE 2.2
Evolution of dependency relationships of children and elderly of the
economically active population: 1980-2050
(A)
0 to 14 anos
(B)
15 to 64 anos
65 years old
or above
Relation
(A)/(B)
Relação
(C)/(B)
1980 45.339.850
68.464.223
(A)/(B)
Relation
6,95%
1990 51.789.936
88.410.746
(C)/(D)
58,58% 7,23%
2000 51.002.937
110.951.338
9.325.607
45,97% 8,41%
2010 49.439.452
130.619.449
13.193.703
37,85% 10,10%
2020 41.571.334
146.447.173
19.124.736
28,39% 13,06%
2030 36.761.006
150.795.092
28.853.932
24,38% 19,13%
2050 28.306.952
138.081.864
48.898.647
20,50% 35,41%
Source: IBGE, 2008.
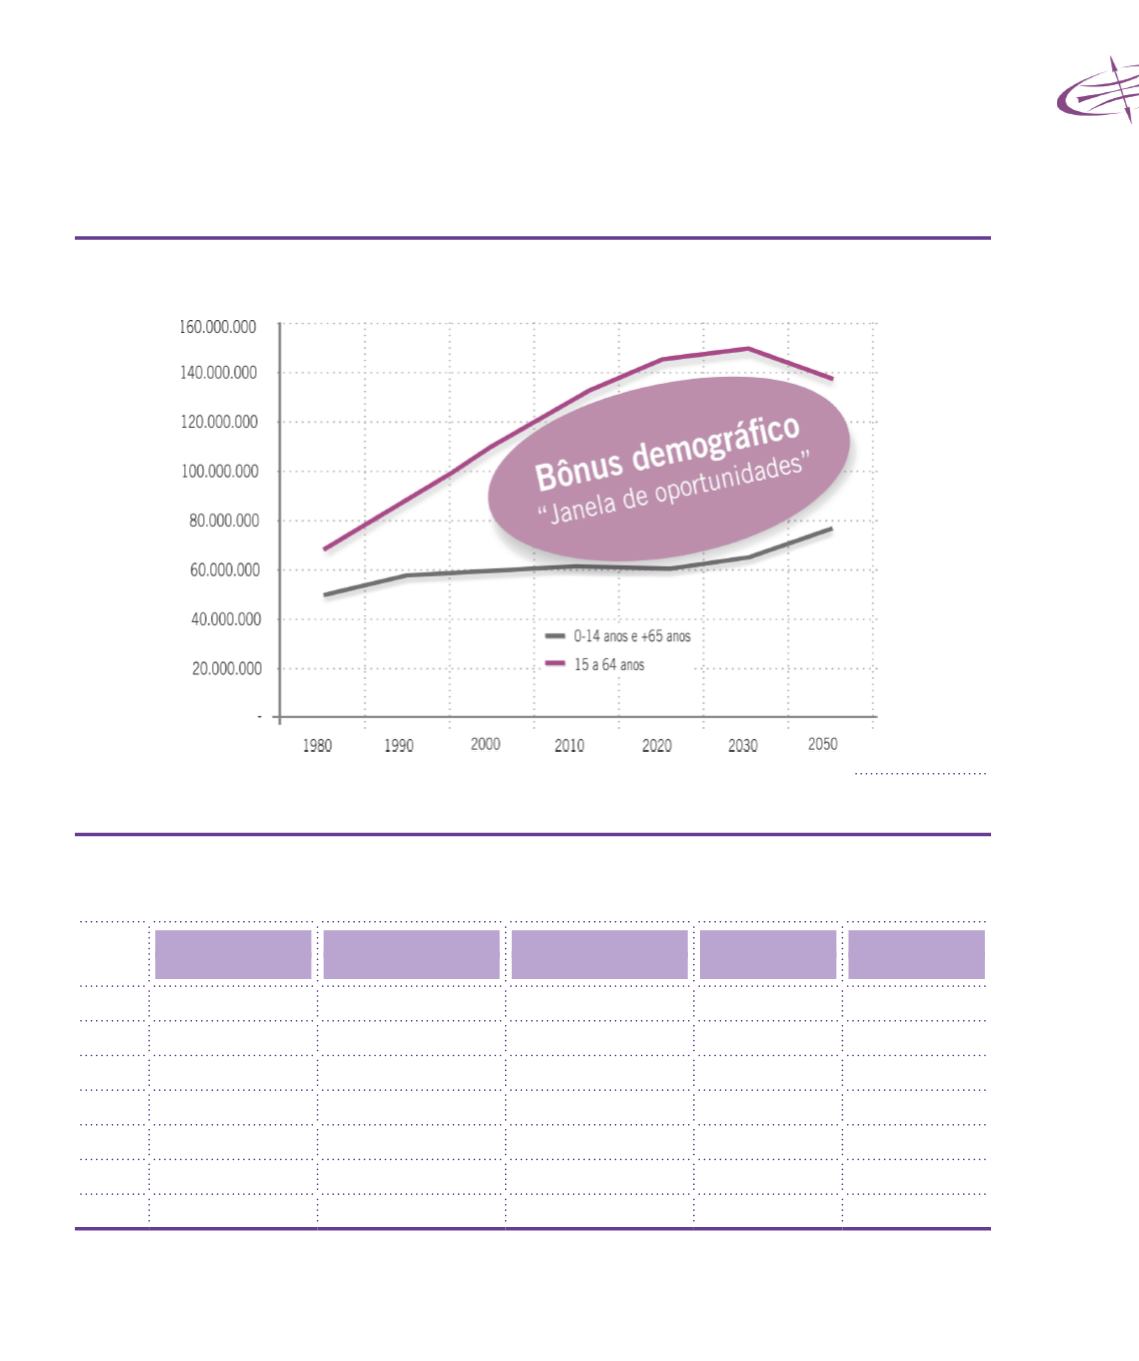
PICTURE 2.2
Identification of demographic bonus: 15-64 years old population
versus(0-14 years old population + 65 years old population or above)
Source: IBGE, 2008